Introduction:
The Homestead Act was passed during one of the most tumultuous periods of American history, the American Civil War. The Homestead Act was passed in 1862 to strengthen Union loyalty, create an alternative to factory labor, and assist in the transition of public land in the West to small, private landowners (Anderson, 2011). The Homestead Act is particularly interesting because of the stark contrast between the way the public perceives the Homestead Act as a spectacular return to the land and the way it is criticized by academics. While the quintessential narrative surrounding homesteading is that it was one of America’s finest achievements, scholars generally see the Homestead Act as not being successful for the small, family farmer. The Act did not preserve land for many of the people that worked on the land for years, and gave rise to speculation and fraud. These arguments made by scholars have “rarely penetrated popular literature or film” because the public is only willing to see the Homestead Act as an inspirational story of people conquering the wilderness of the Great Plains (Cannon, 2013).
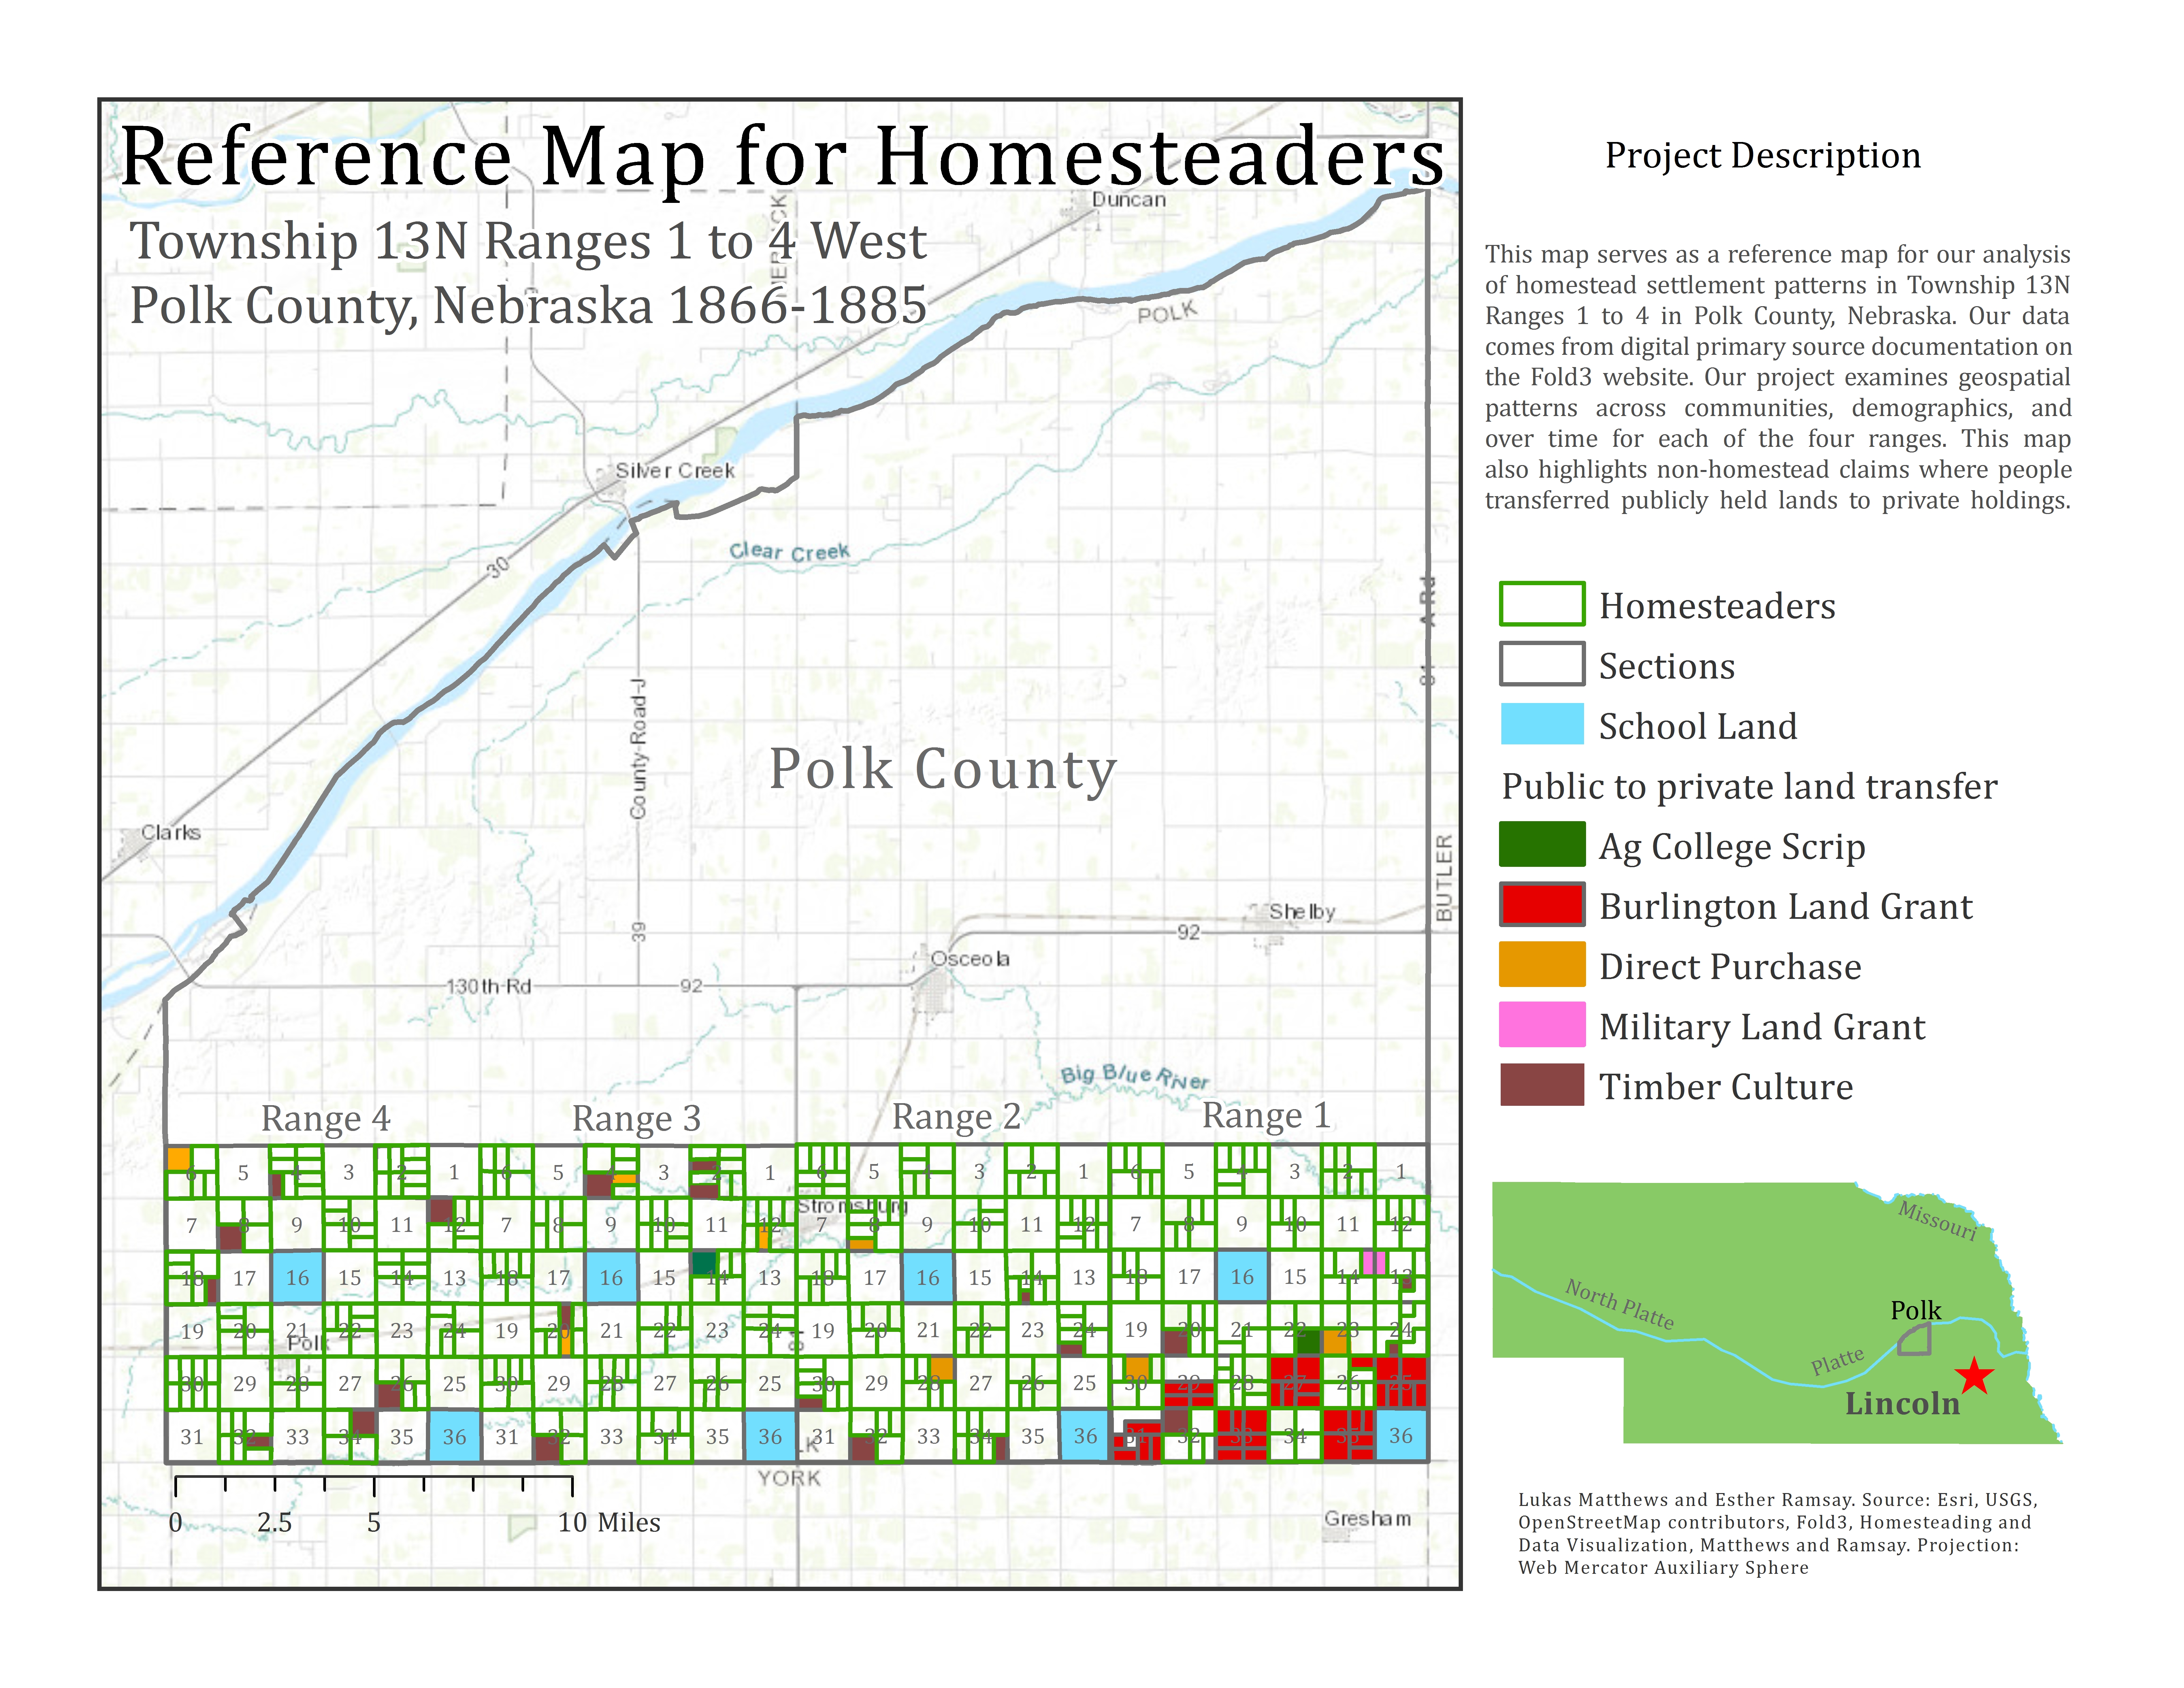
Both scholars and the public present biased arguments about the impact of the Homestead Act on the American West. Based on often inaccurate or incomplete data, homestead scholars have adhered to what Edwards et. al refer to as “stylized facts” along four lines: homesteading had a minor impact on farm formation, most homesteaders failed to prove up their claims, the homesteading process was rife with corruption and fraud, homesteading caused Indian land dispossession (Edwards et. al, 2017). Their work makes meaningful contributions towards correcting the conventional wisdom, contributions we wanted to support with our own project and class work. In addition to supporting this reframing, we also took greater liberty in examining the characteristics of individual homesteaders. While Edwards et. al examine Dawes and Custer counties, our project looks at new data in Polk County, Township 13 North Ranges 1-4 West.
The issue is not that there is a dearth of accurate data available on homesteaders: there is an entire archive of documents submitted to U.S. land offices housed at the National Archives. The issue is that few researchers have the time or funds to explore these primary source documents and instead rely on secondary source documentation or first-person narratives. Our efforts have demonstrated the benefits of taking the time to explore the available homesteading data in depth. We compiled characteristics of each claim and claimant for almost 400 records, which was possible thanks to Fold3‘s efforts to digitize the homestead records at the National Archives. Our database is a compilation of geographic and demographic data, as well as data on the improvements the claimants made to their homesteads.
Our analysis is interested in using a series of maps to visually explore any patterns or variation within our database. We divided our maps into two main categories, in addition to our reference map for Township 13N: demographics, and measures of success
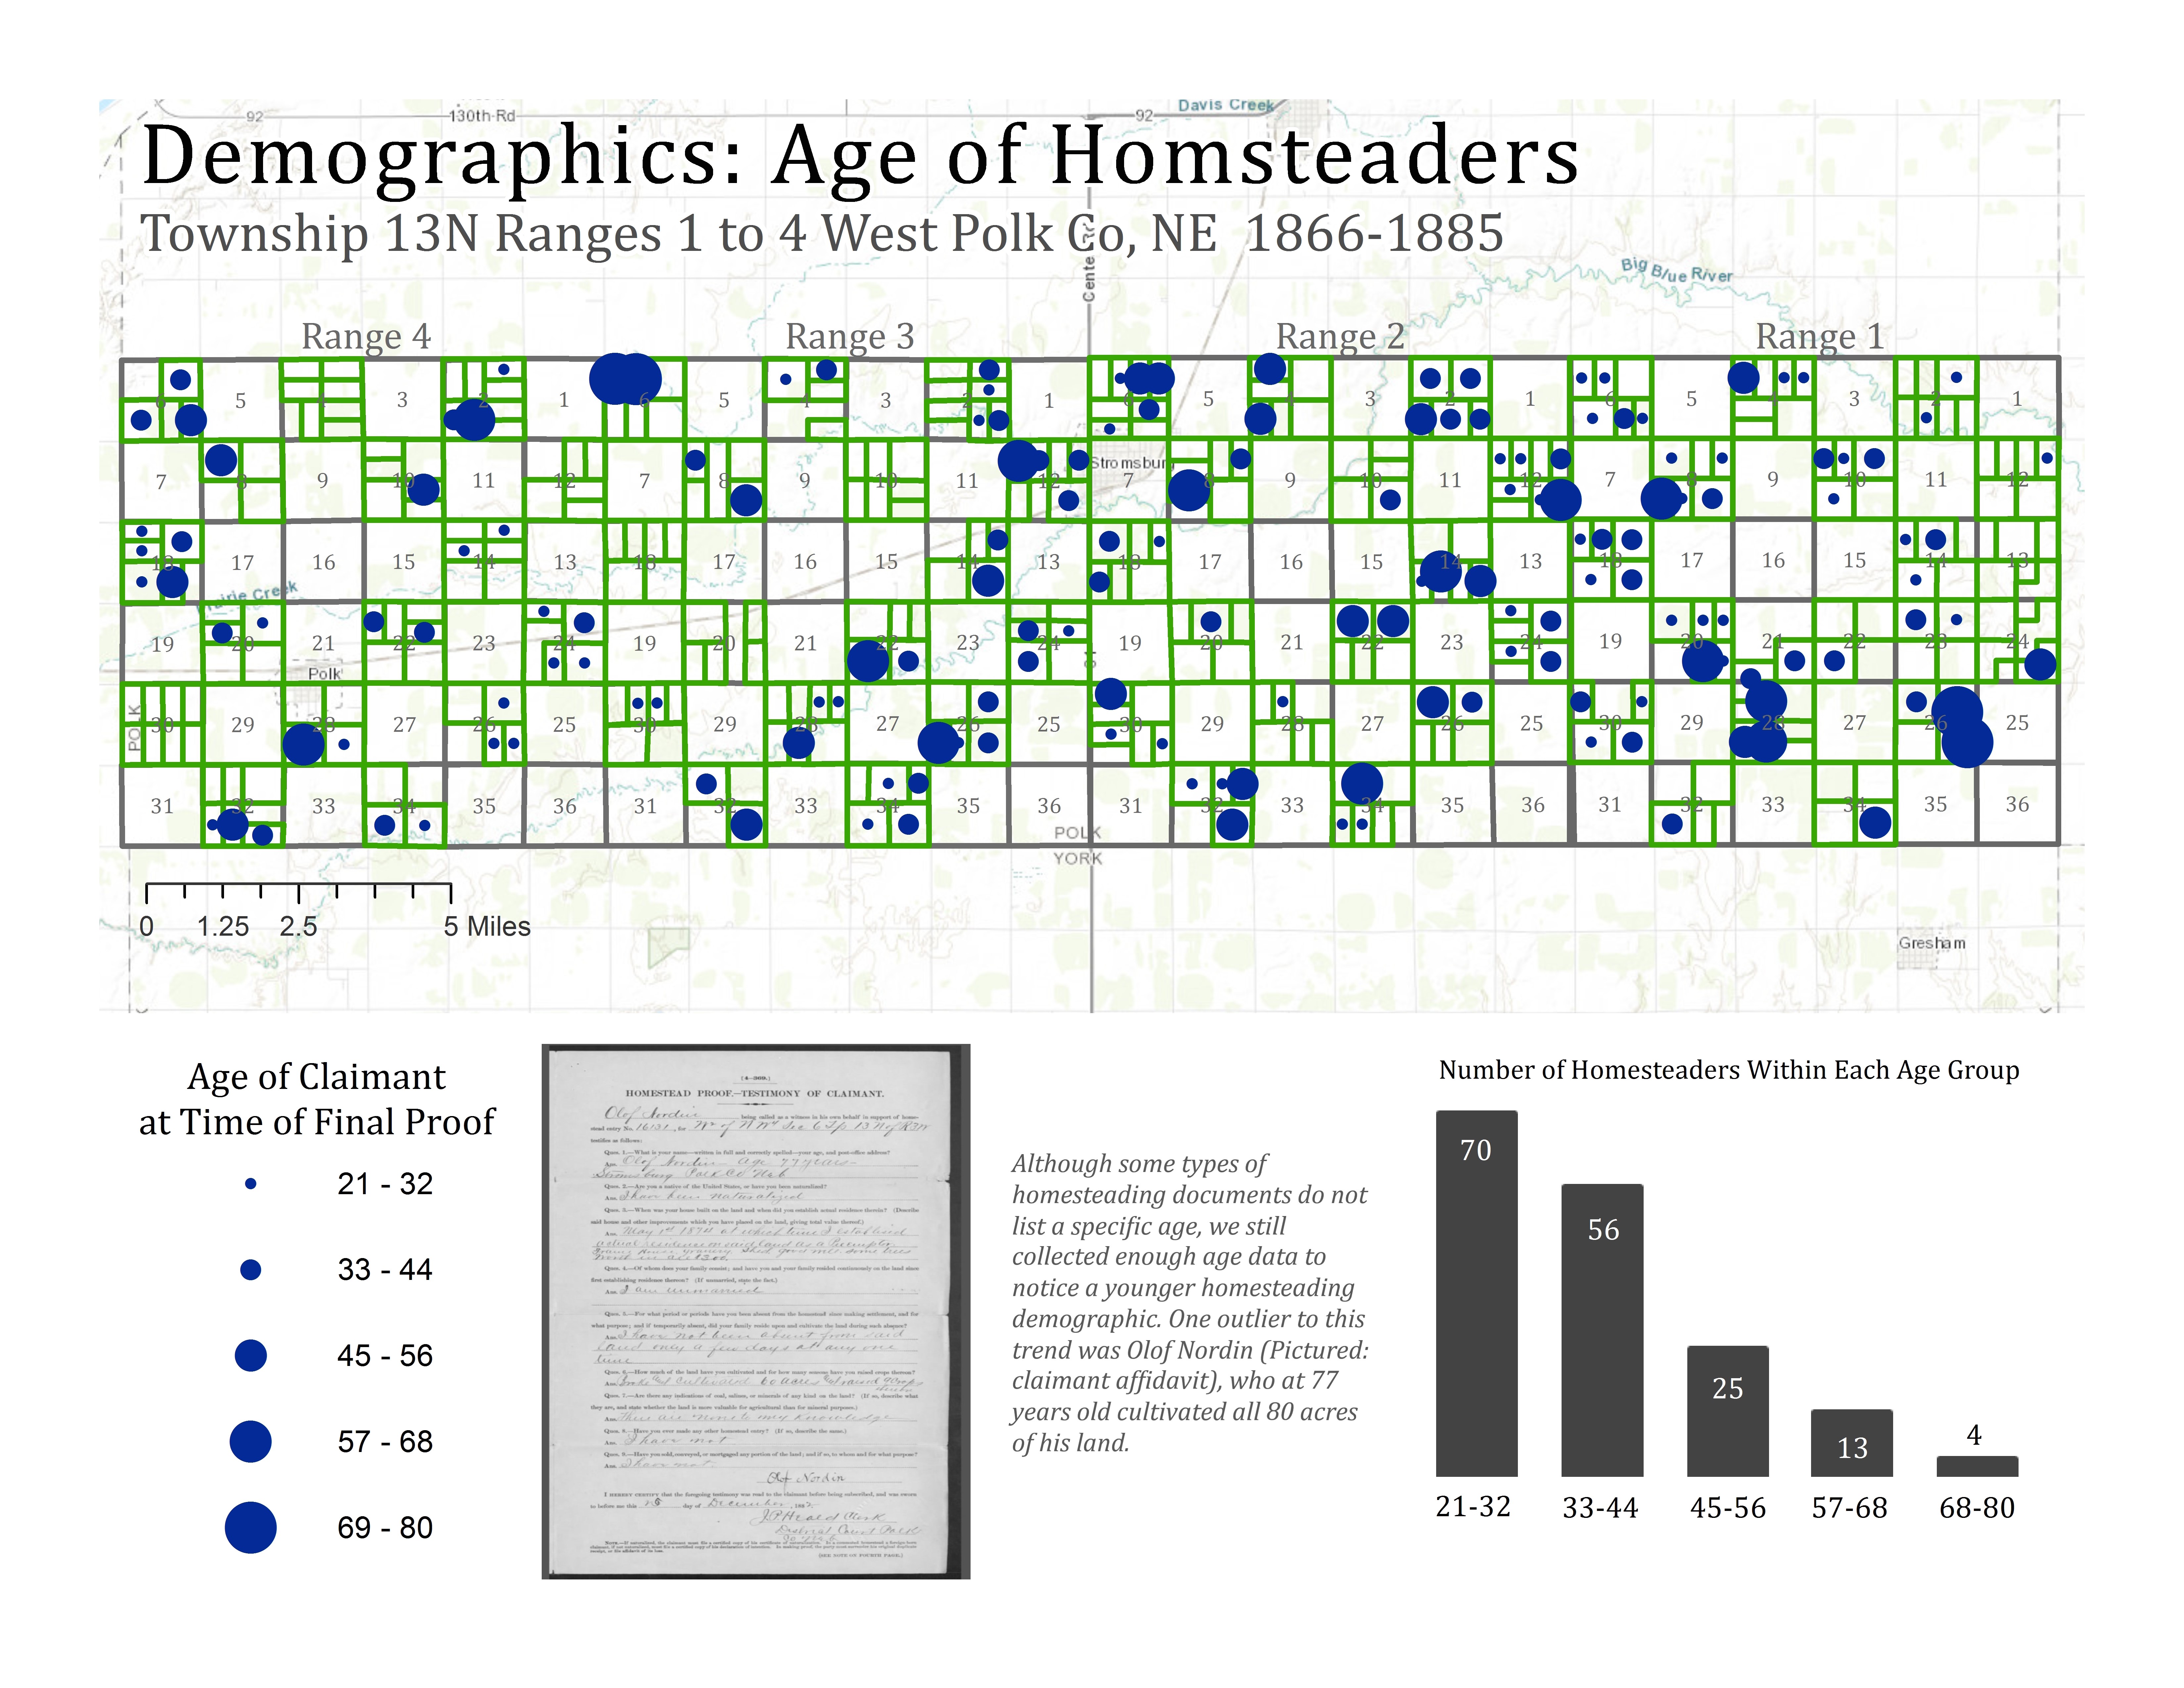
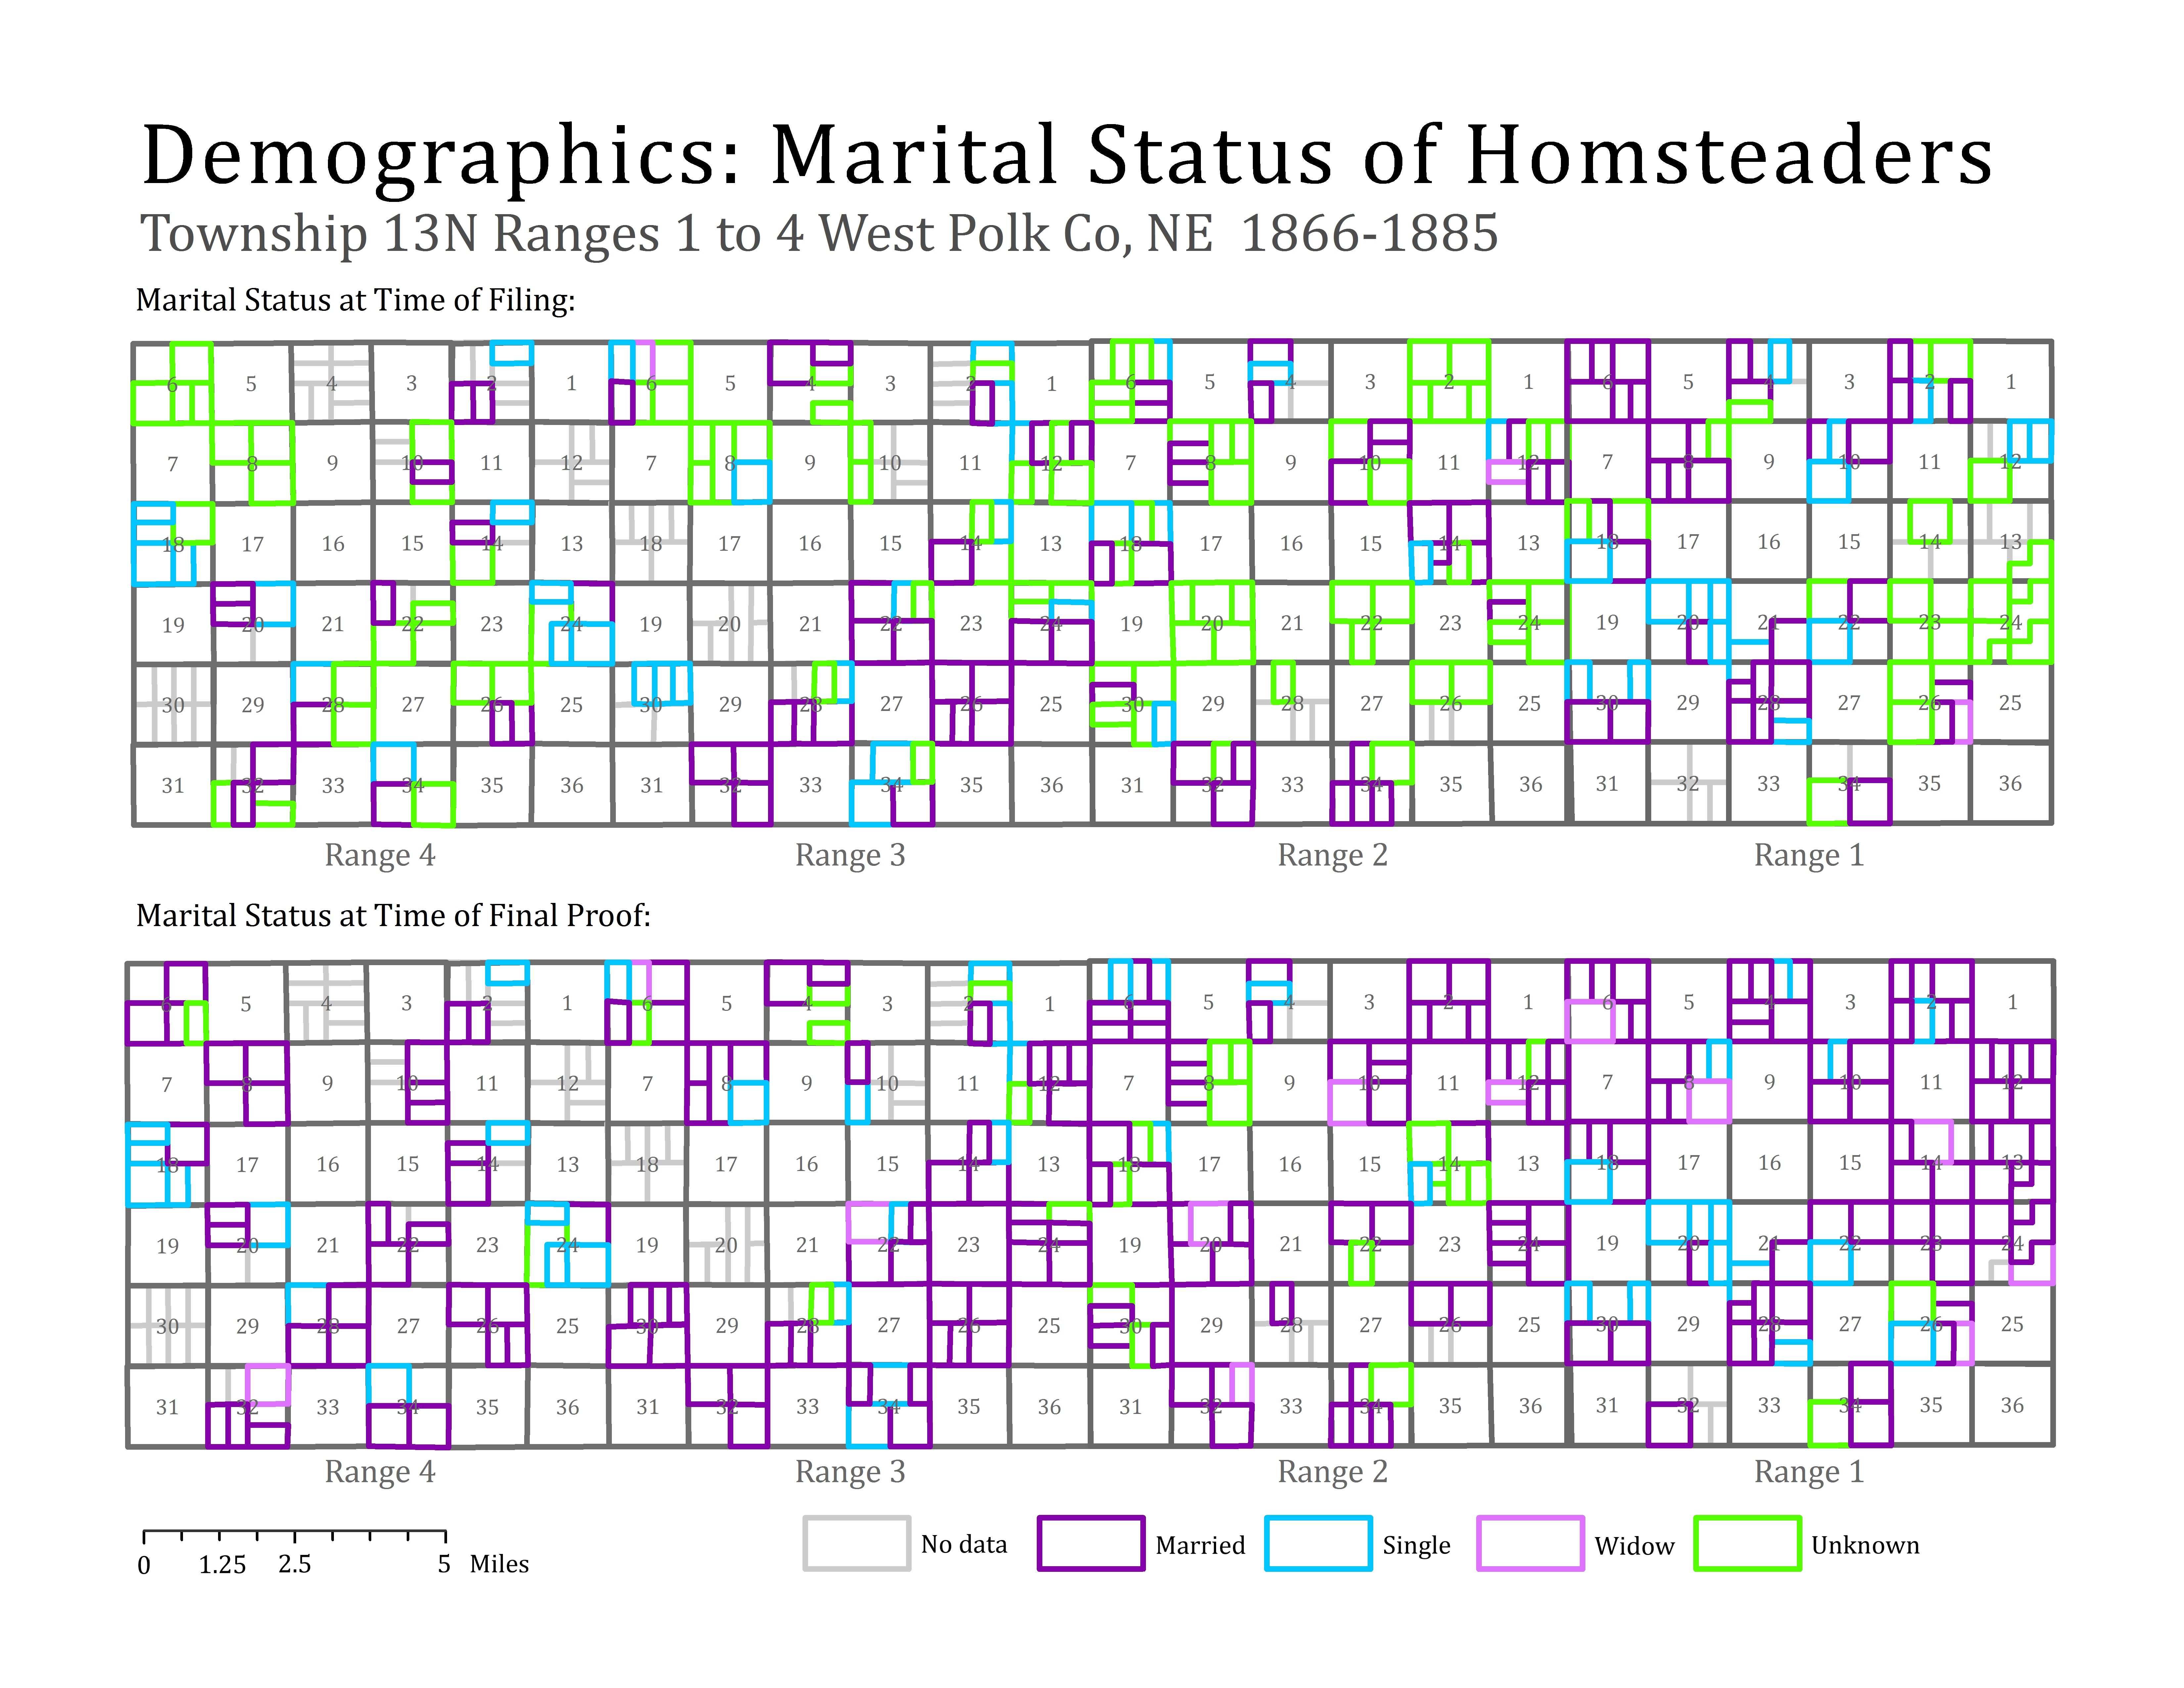
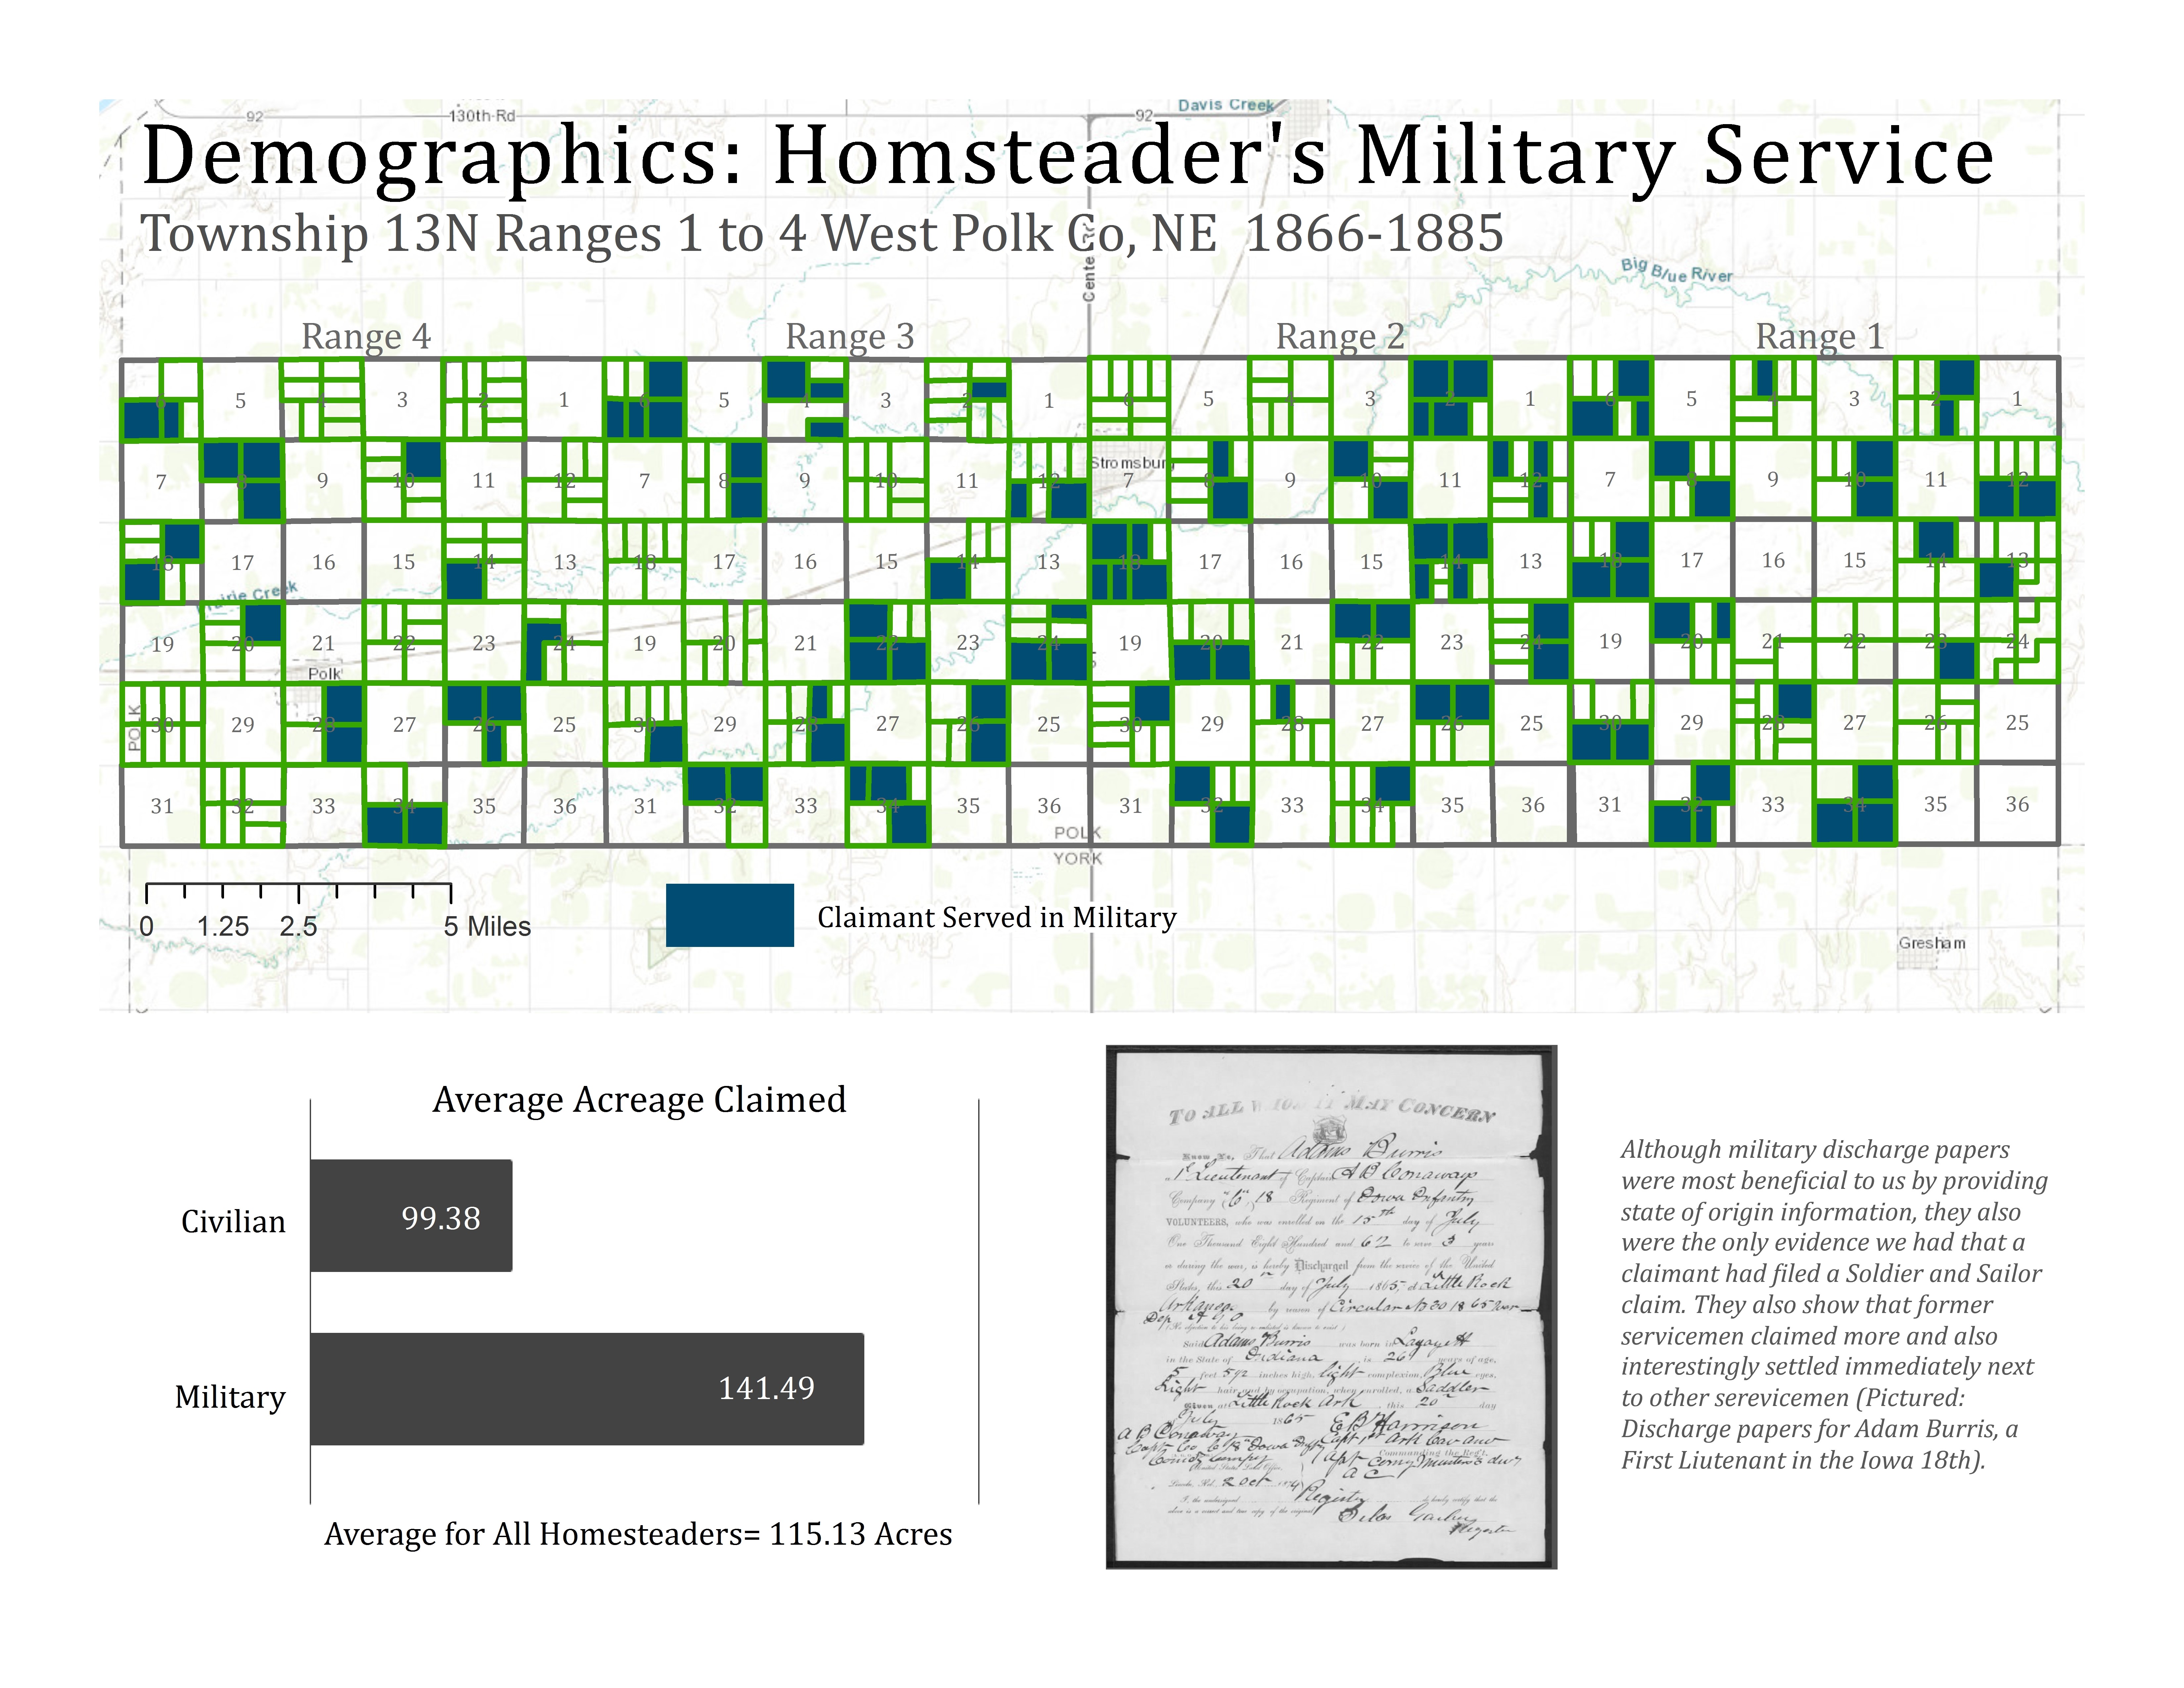
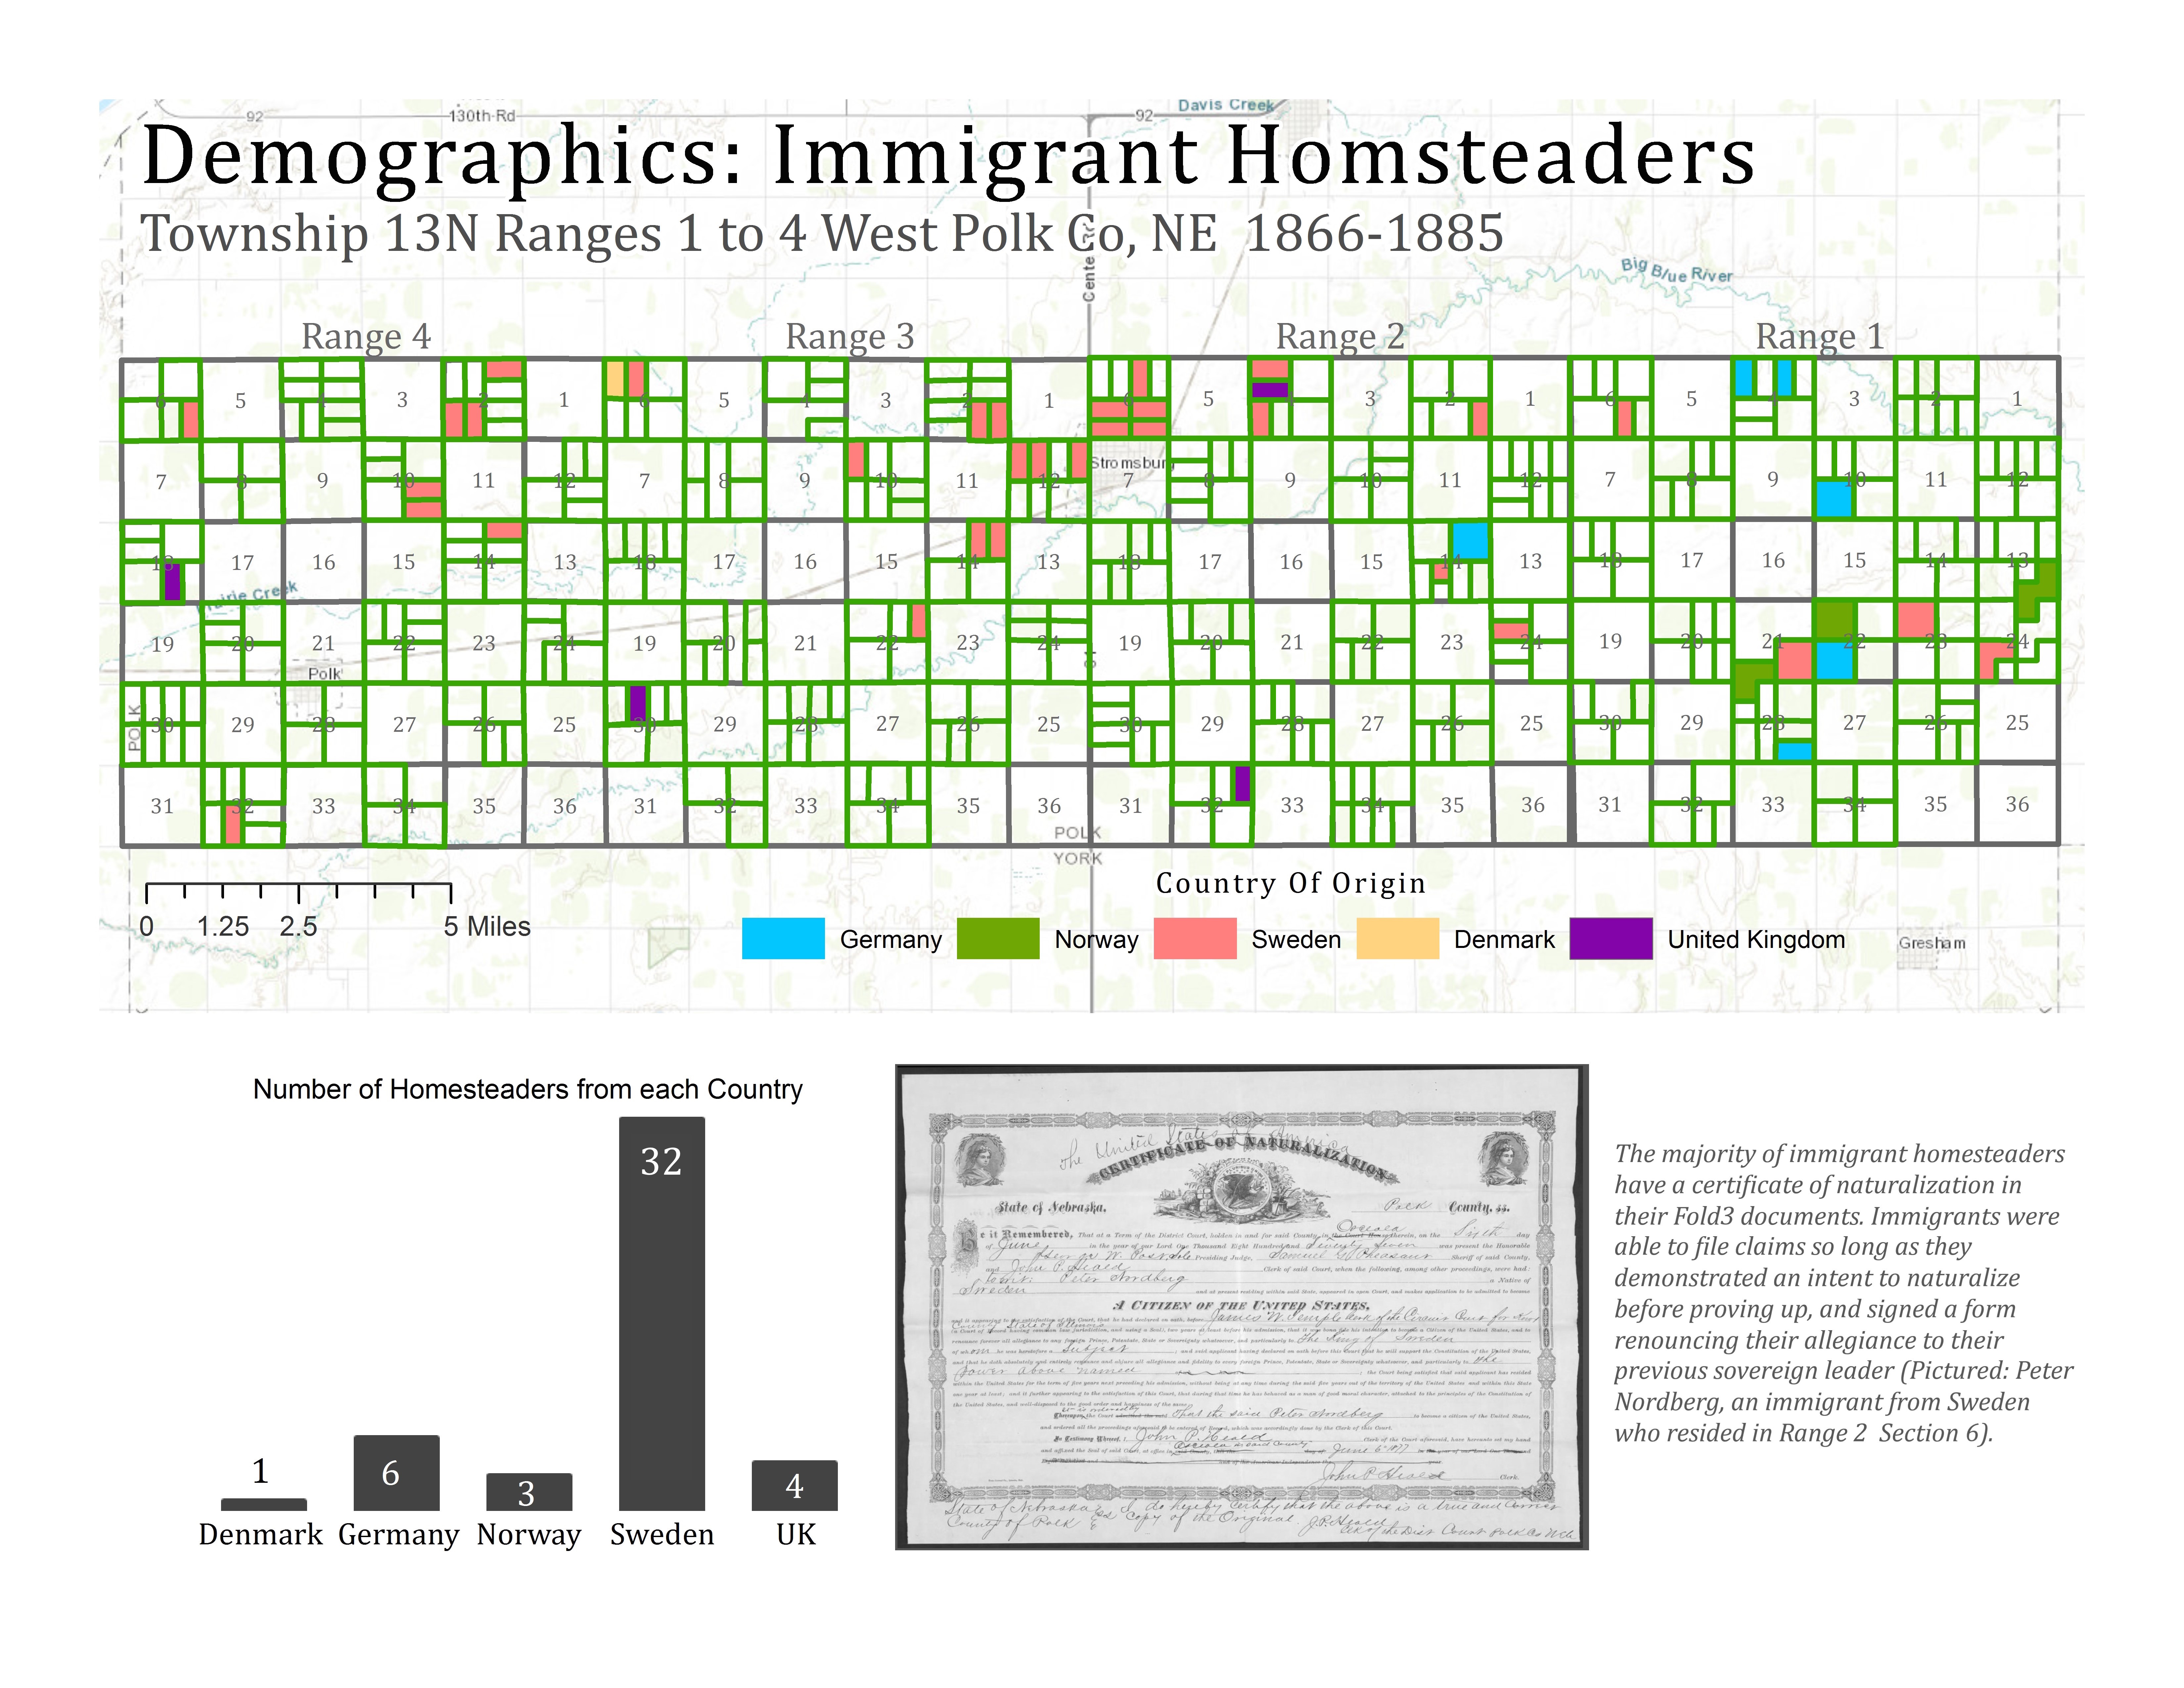
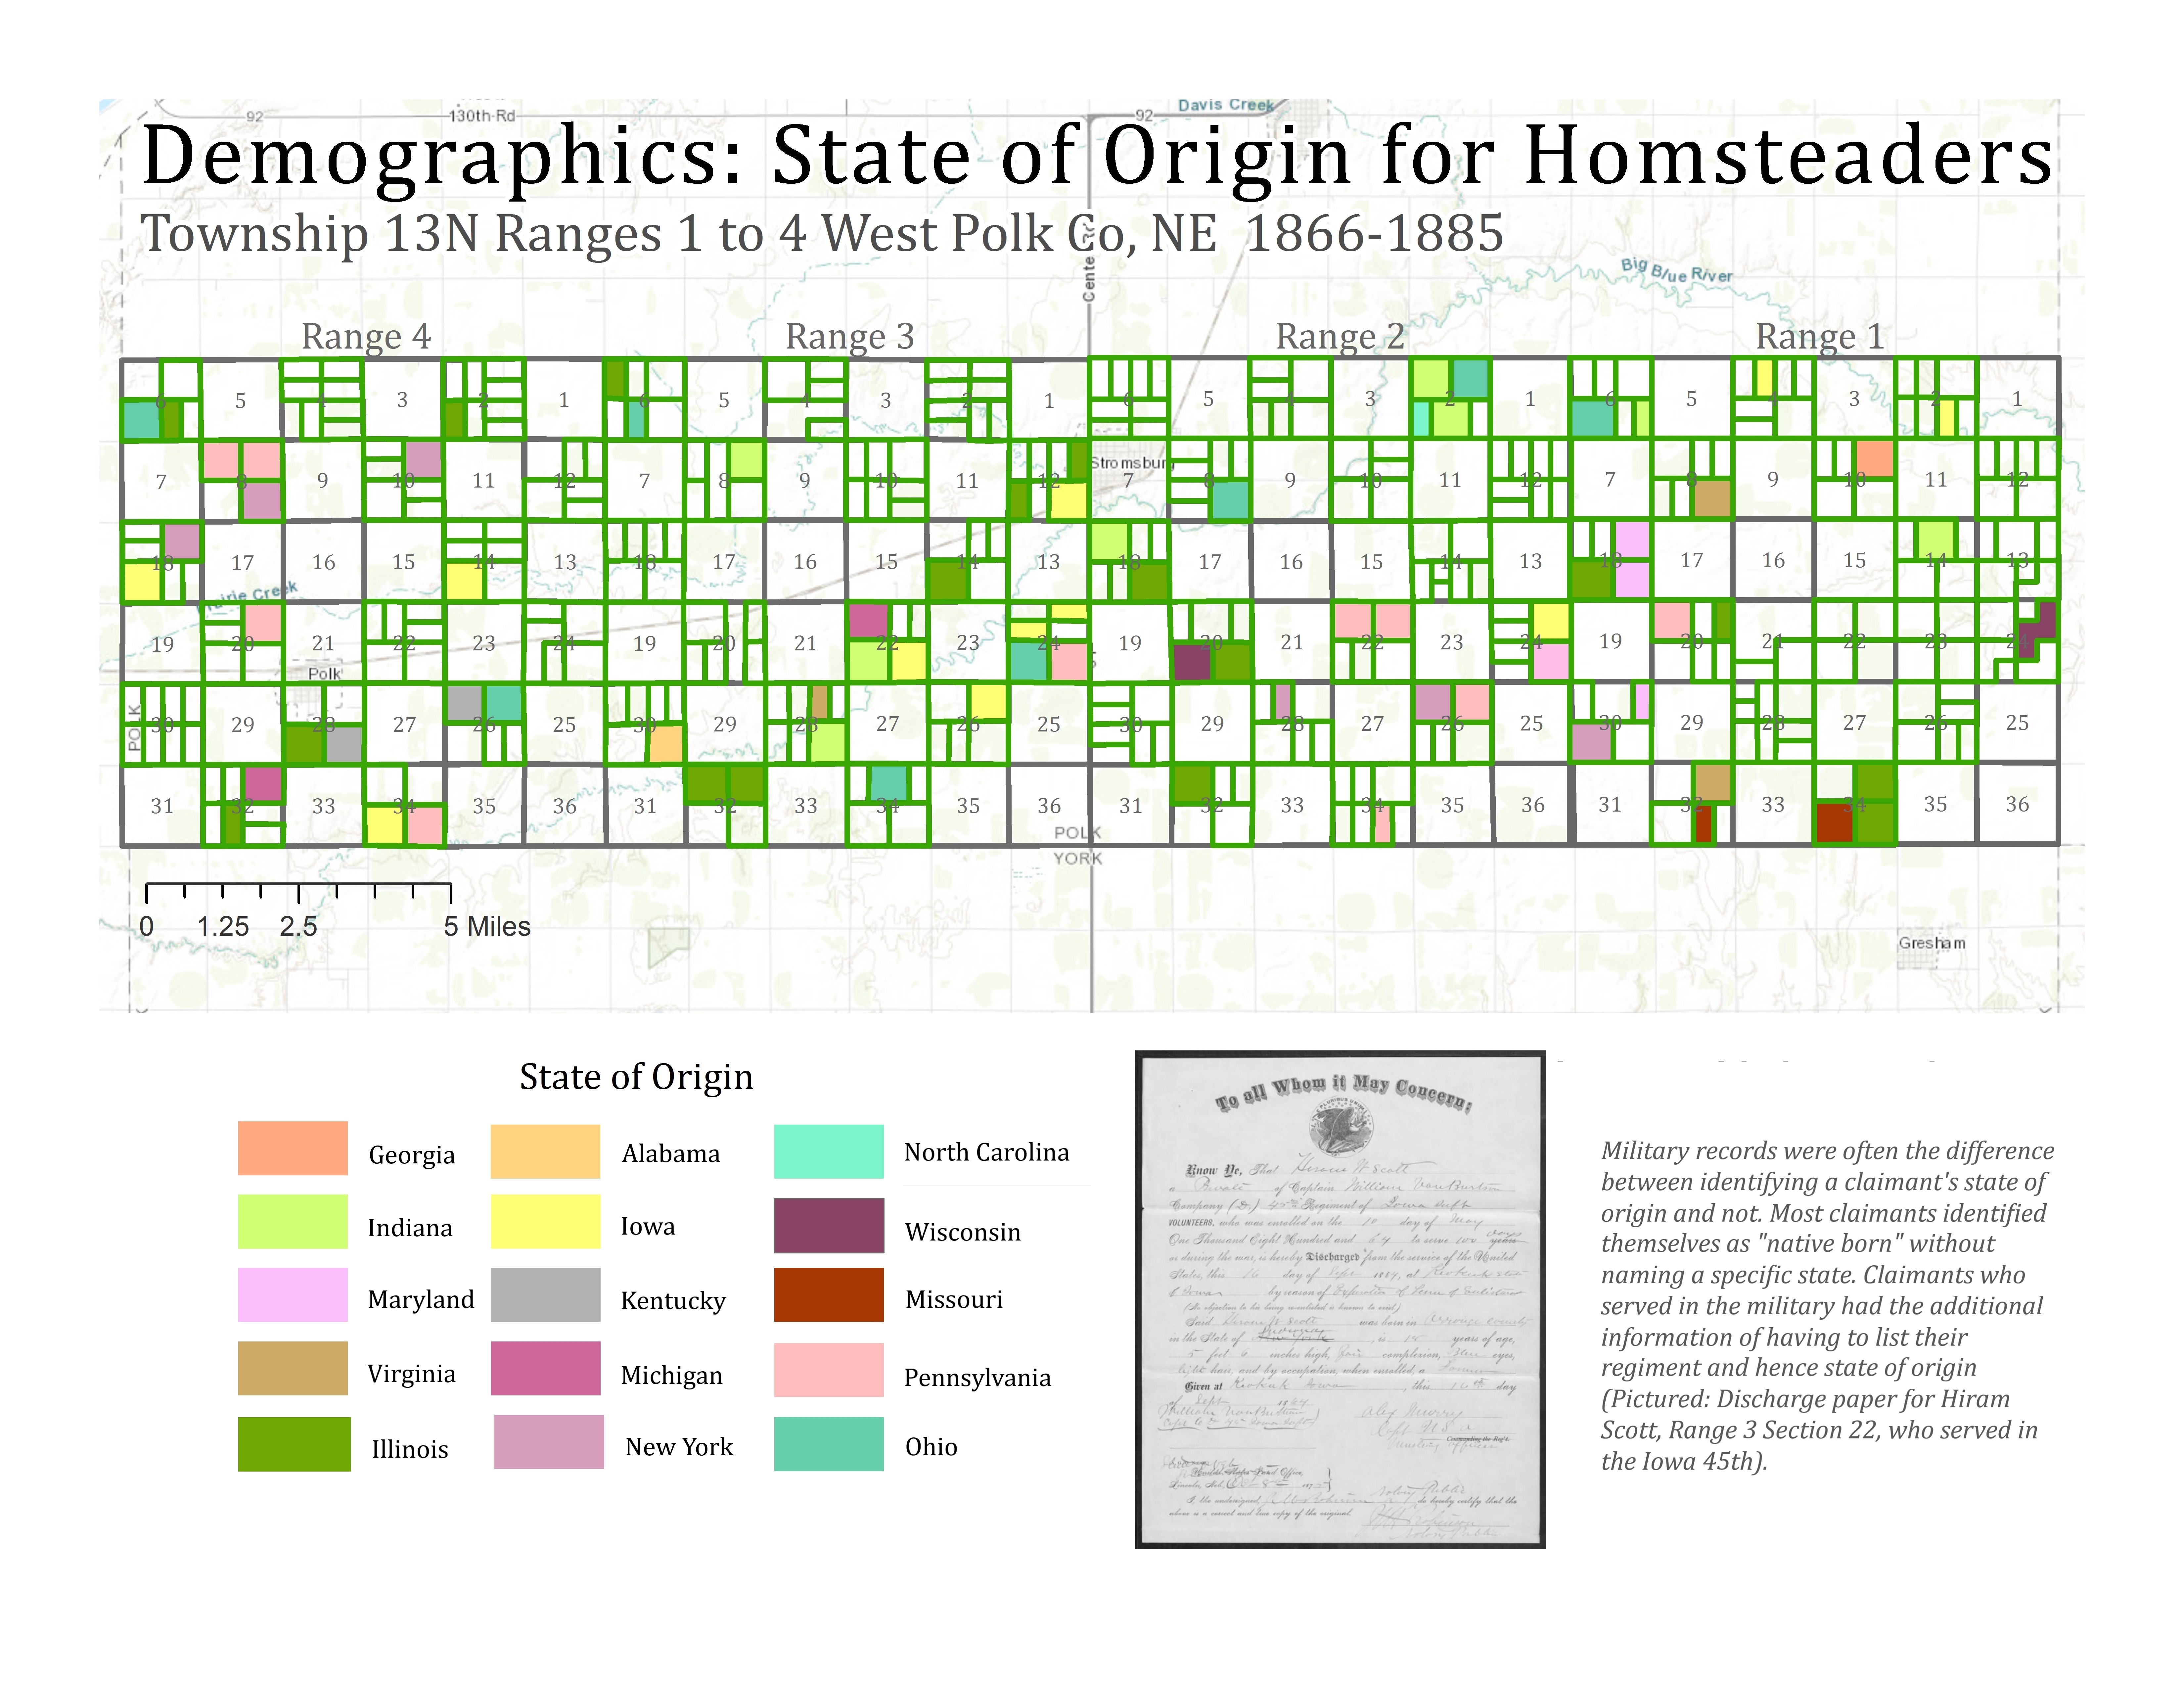
 The demographic maps provide important and detailed summaries of the homesteaders living in our study area. These maps shows the general patterns and characteristics of the homesteaders that resided on each claim. These demographic maps focus on age, marital status, military service, country of origin, and state of origin of the claimant on the application.
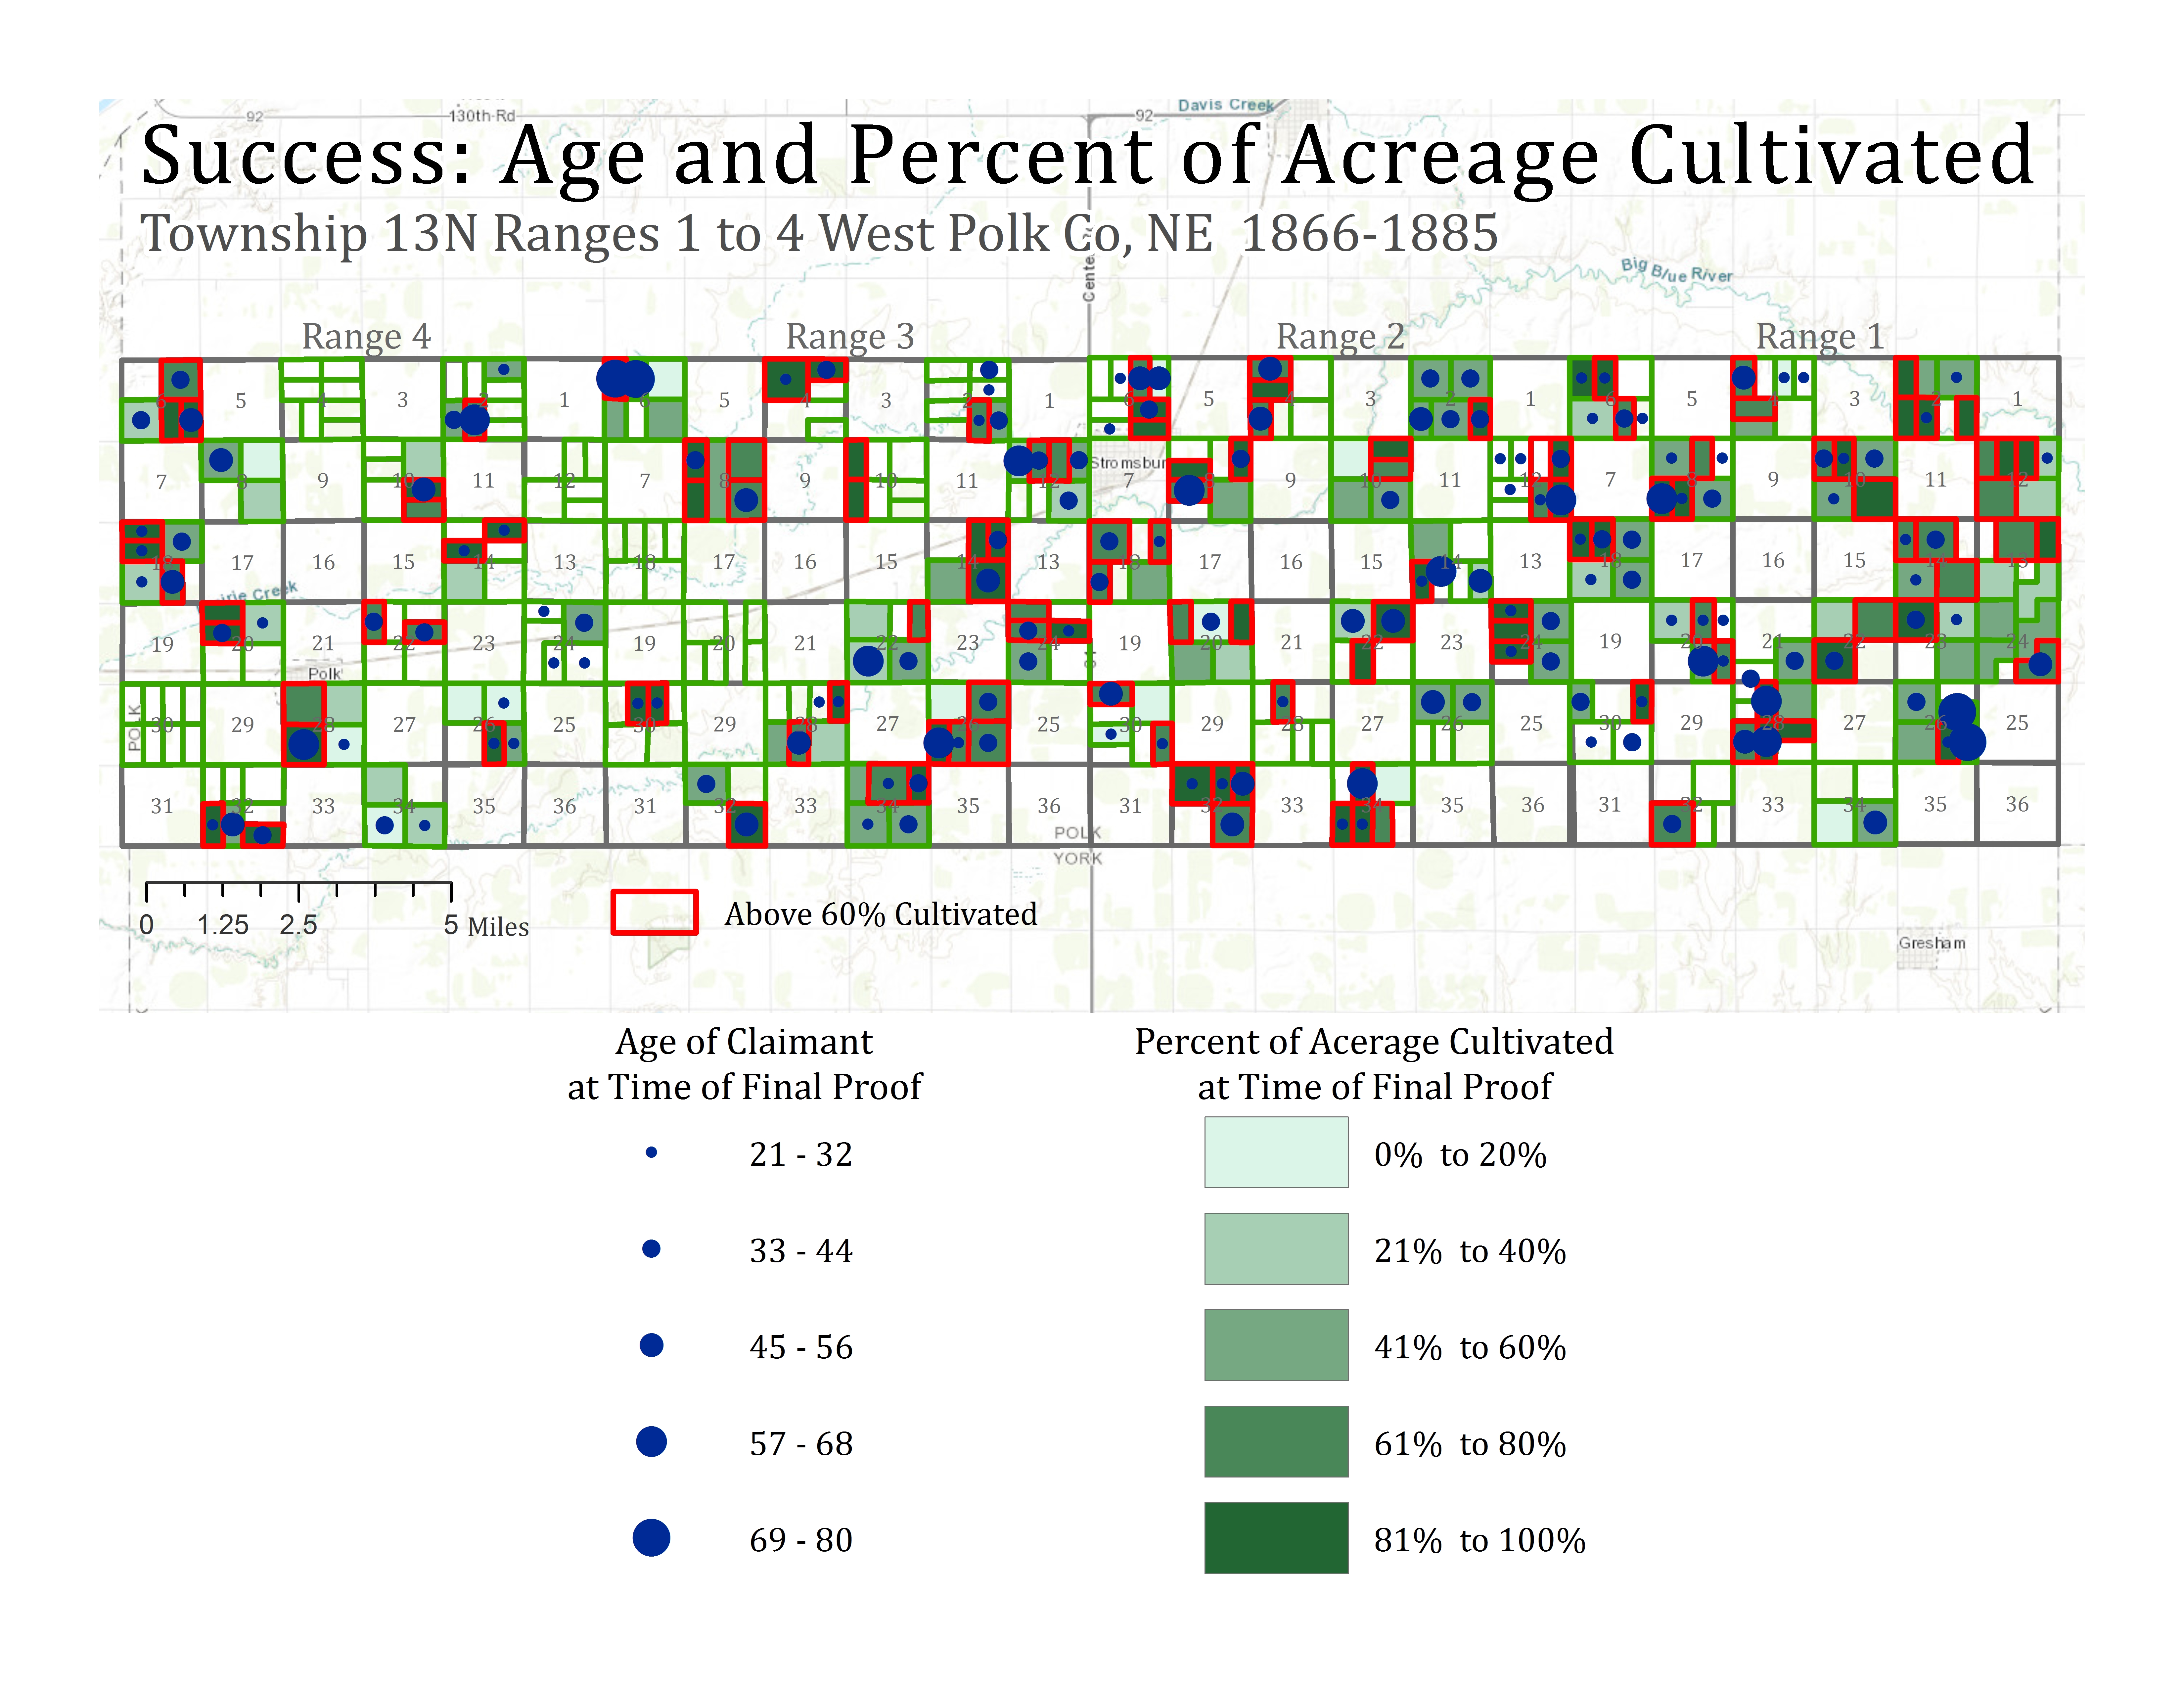
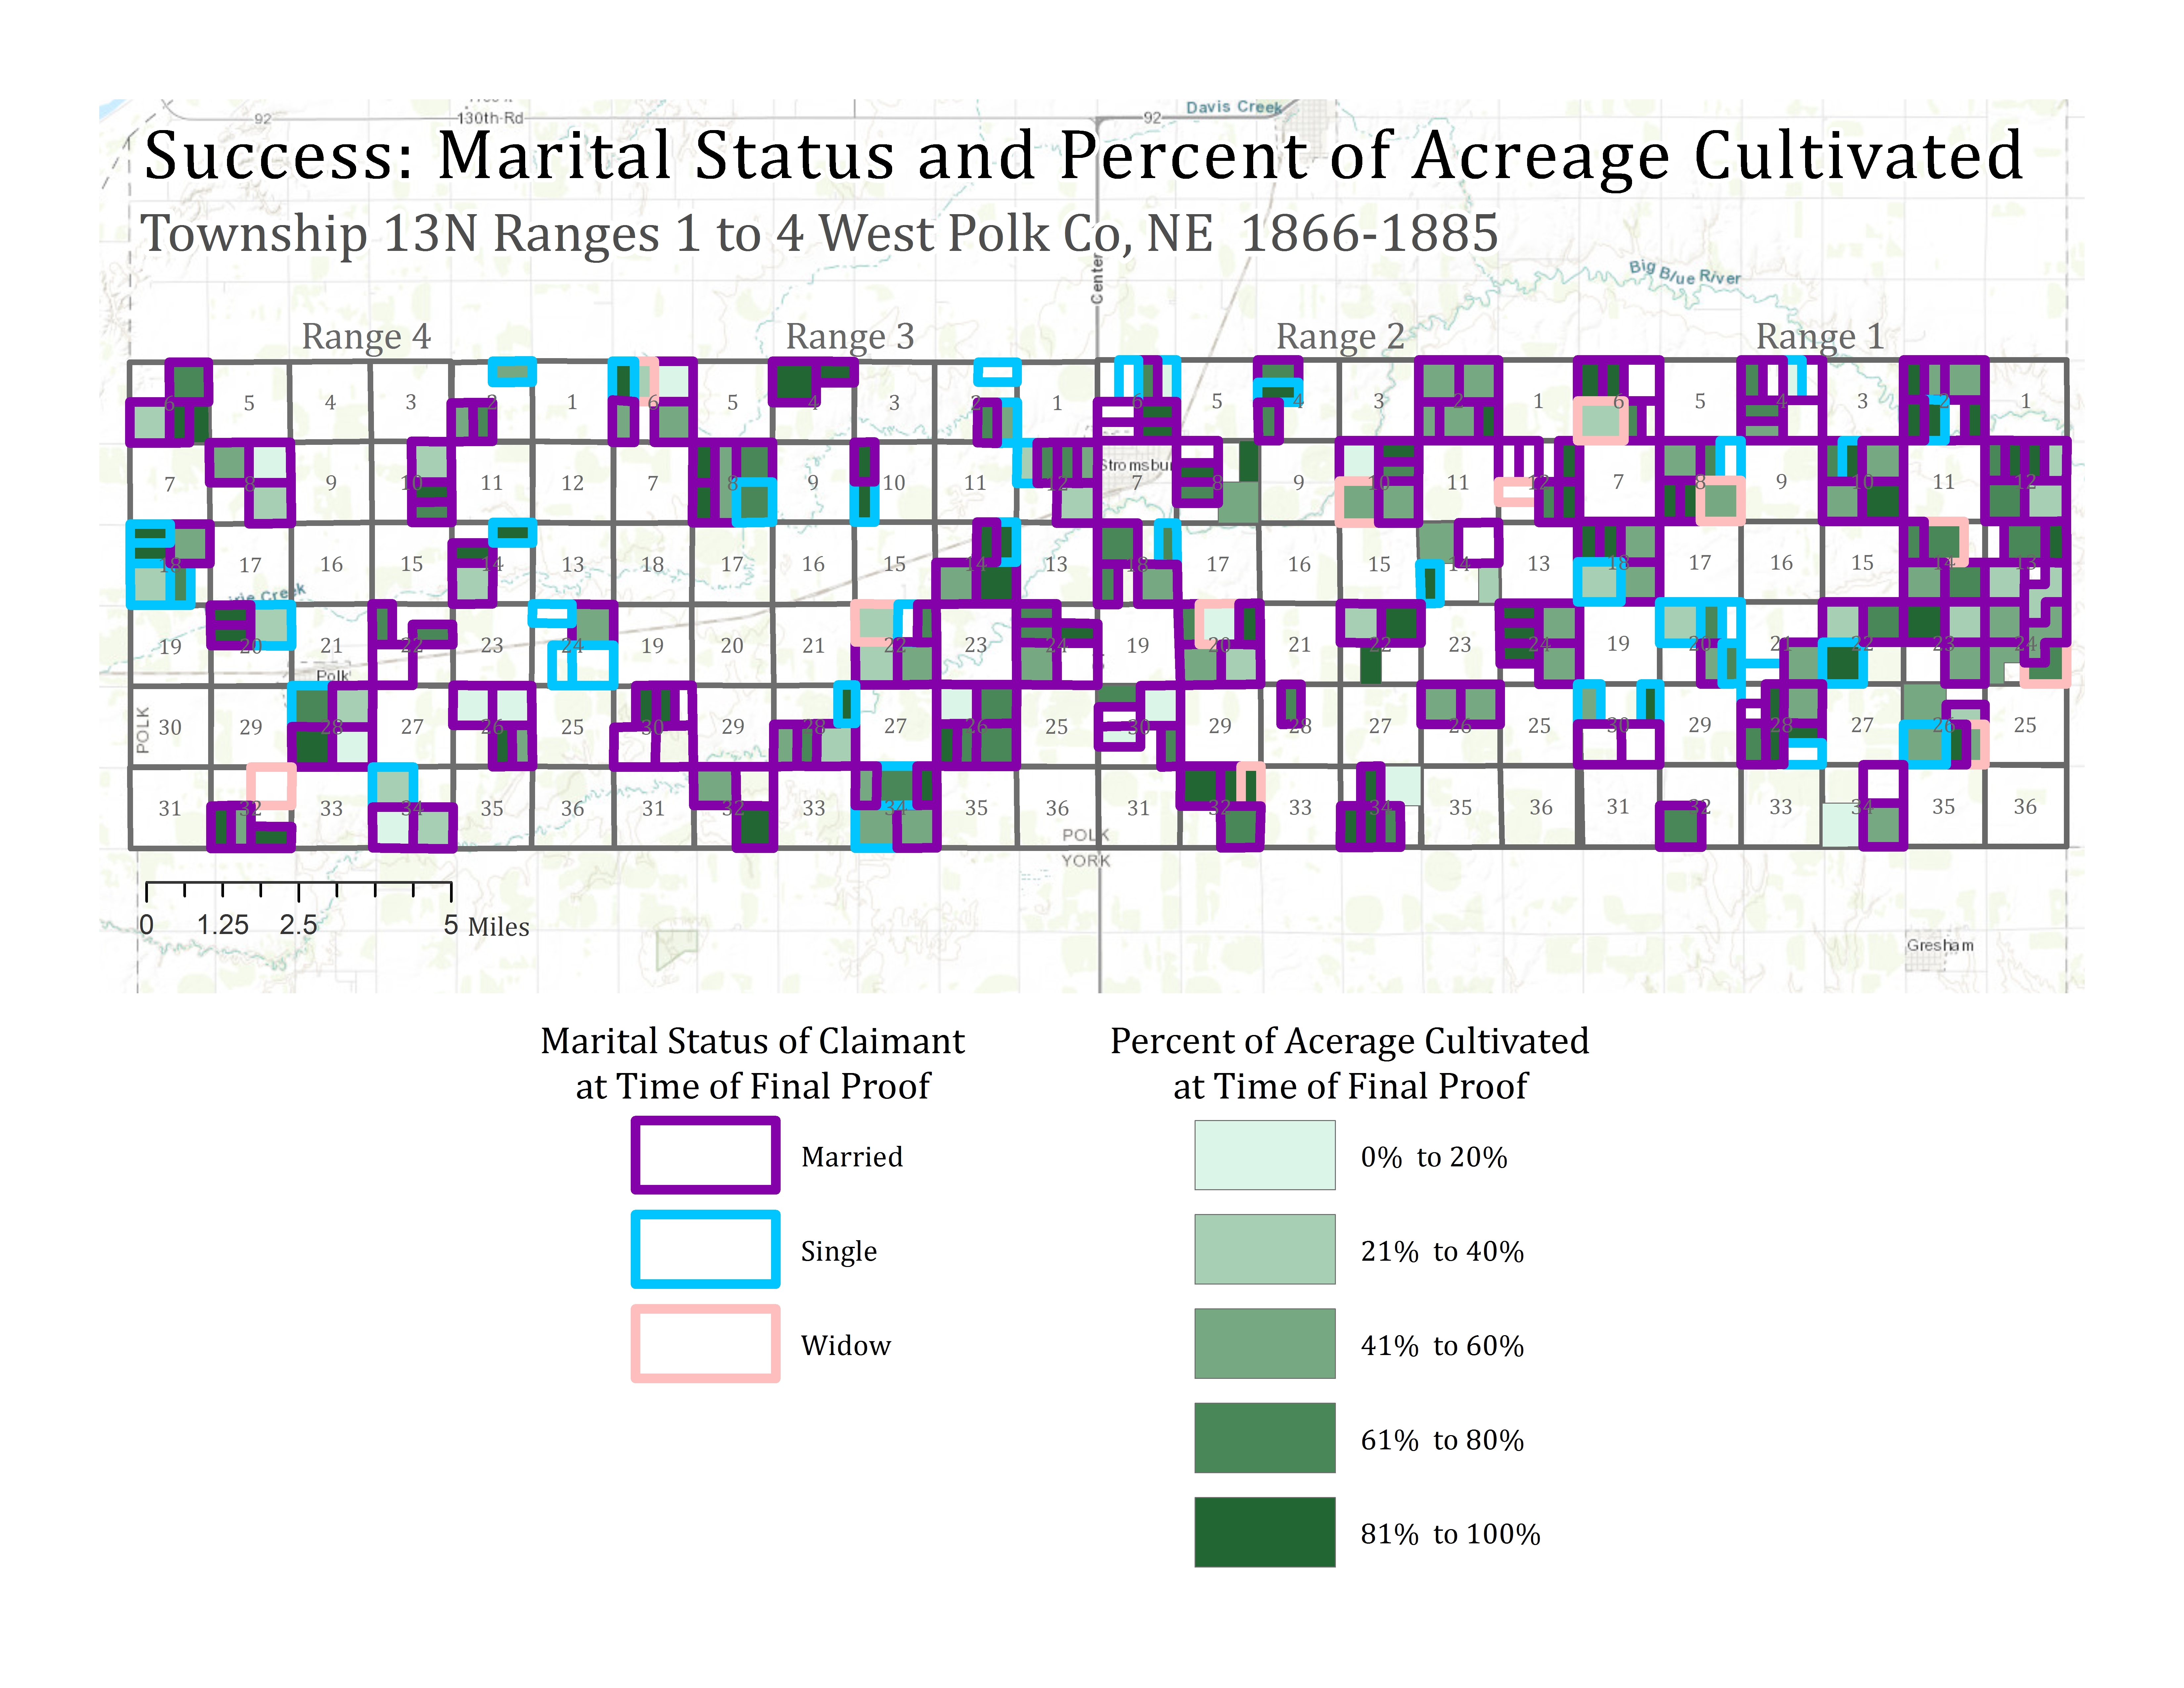
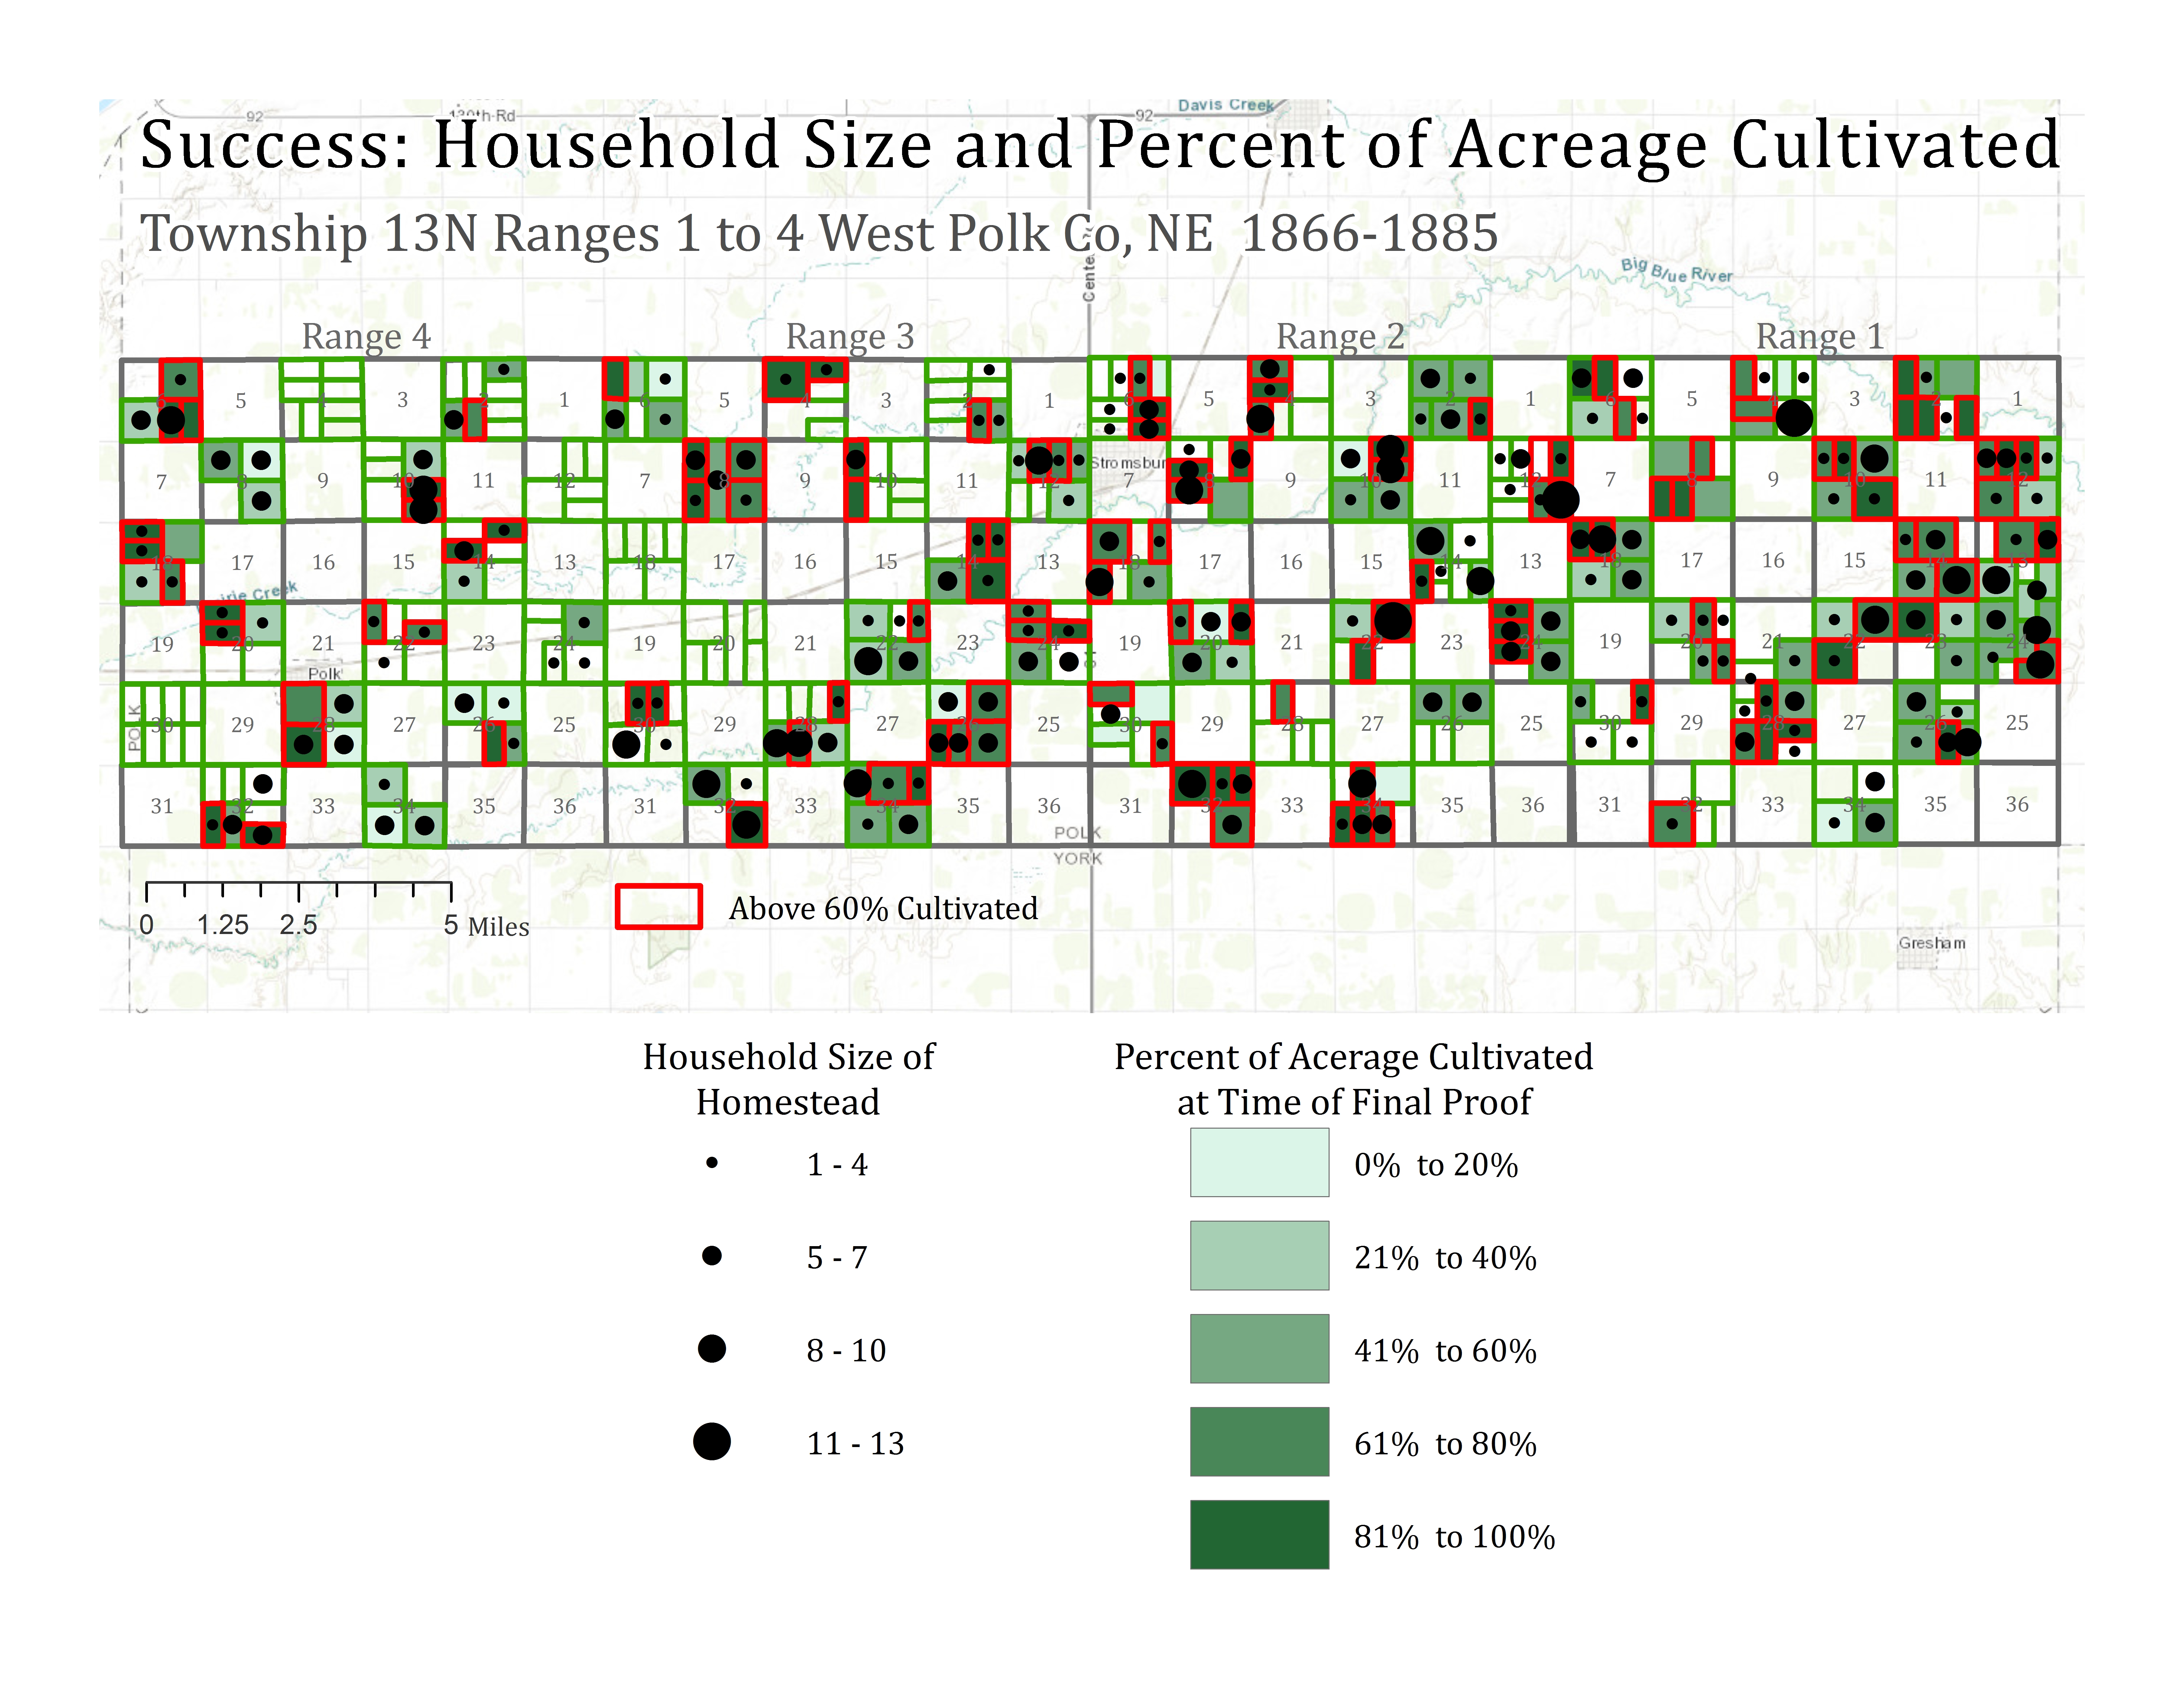
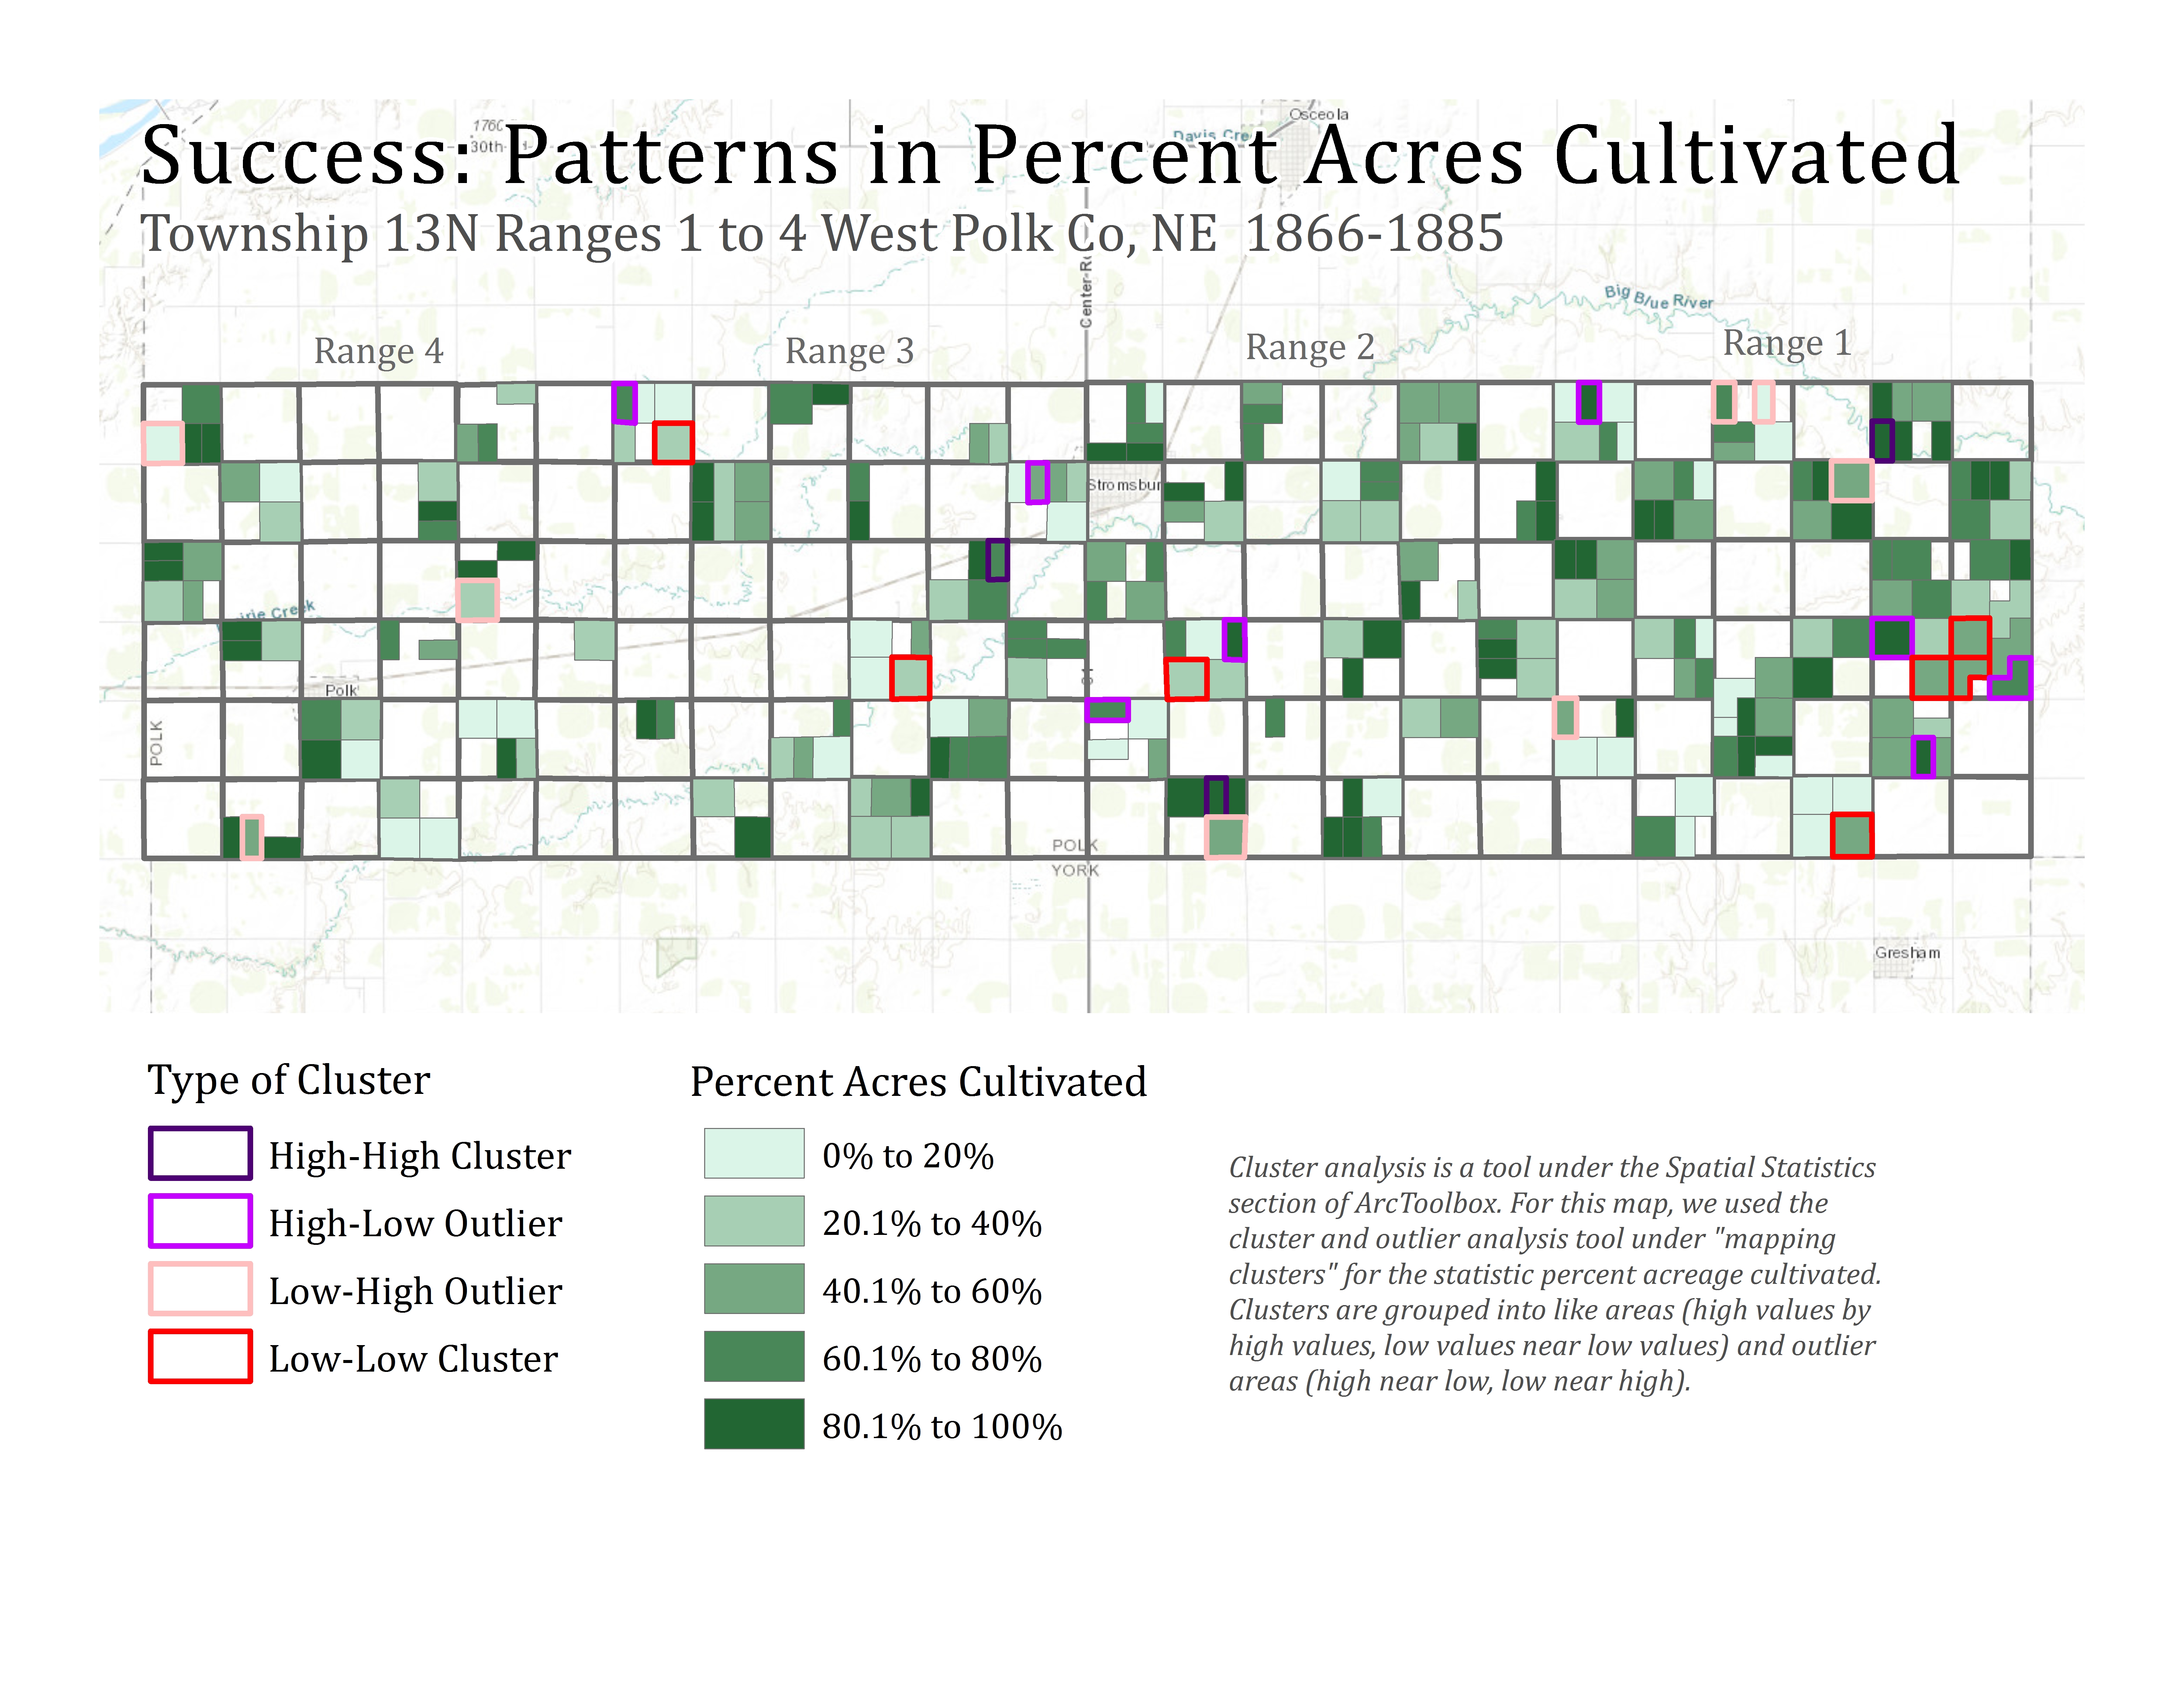
 The level of success maps demonstrate what attributes led to the greatest success. These maps focus on the relationship between percent of total acreage cultivated and age, marital status at time of final proof, and household size. We also used a tool within the ArcGIS software called cluster analysis that identifies similar values and outlying values. We used this tool to analyze clusters of success or stark variation in success in percent of total acreage cultivated. There is an interactive feature in this section of our Story Map that shows our speculation for how this cluster came to be identified statistically.
Now that we’ve introduced our spatial layers through static mapping, we invite you to get creative with homesteading maps through our interactive Story Map!
Methodology:
We used maps, graphs, and literary analysis to understand any patterns that may exist in Township 13N, Ranges 1 through 4 West in Polk County, Nebraska. We created maps to find and understand patterns and clusters within our data. Some maps use outlines around specific features to reveal trends we think are important. Other maps compare the evolution of features from one feature to the next; we compare marital status, for example, at the time of filing and the time of proving a claim. We also used graphs to show basic statistic and trends amongst our demographic data. The literary analysis of scholarly resources was used to explain patterns and trends that we found while making our maps and graphs.
Conclusion:
For Demographics: We had a large age range, large population of Swedes and a cluster between ranges 2 and 3, large population of former military servicemen that claimed more acreage, and that many homesteaders were married and had families.
For Success: We found that younger people tended to be more successful especially 30 year old range with families, marriage did not mean success but single and widows cultivated smaller percentages of their acreage cultivated, large households were not more successful-> medium households tended to be the homesteads that cultivated over 60 percent of their total acreage.
Cluster Analysis: Most high-high clustered values were married and surrounded by other married people with a few children. Most low-low clustered values were older people in sections with single or/and widow homesteaders. Low values in high value clusters were usually widow or single person on the older side or immigrants isolated from other immigrants that were in a cluster of families. High values in low value clustered area were young married people with two or three kids near widows or single homesteaders. We had a few interesting outliers where a person either did better or worse than expected based on their age, country of origin, marital status, and household size. To explore these outliers go to our story map and click on the the cluster analysis map under the “success” tab to have an interactive experience were you can click on a value and a pop up will appear that summarizes the homesteader and why the value is an outlier or why a cluster exists in that area on the map.
Limitations:
Like any good researchers, we recognize that our research model has some constraints. First of all is that the reliability of our data is constantly in question. We have no idea how many acres were actually cultivated: Although there might not be an actual incentive to misreport acres cultivated, some Homesteaders could have interpreted it as necessary to inflate the value before proving up. While our data sample is adequate for beginning to visualize this information geographically, we would have felt more confident in our visual analysis if we were able to look at the whole of Polk County. Lastly, we recognize that visualization might not be the best layout for some reviewers of our work. Some people are better at quantifying numbers through textual representation and would have preferred to see values for each claim quantified. To respond to all of these limitations, this is merely a beginning. With more integrated analysis, including statistical modelling, it might be possible to examine the potential for erroneous (fraudulent) data reporting. There are millions of Homestead records to digitize and visualize using mapping, and we are planning to continue expanding our geographic understanding of Polk County in the near future. And geographic analysis is just one way to analyze homesteading data; already on this webpage, we see important contributions to our understanding of Homesteading using network and statistical analysis. There is undoubtedly more advanced geographic analysis to do, and our contributions to a new way of analyzing the Homestead Act open up opportunities for future analysis.
For future researchers:
Given the time constraints of our project, we were only able to look at the above variables. We would have liked to examine settlement patterns over year, specifically related to the development of our Swedish immigrant cluster. It also would have been interesting to look at settlement patterns for relatives. Another type of analysis that we considered but ultimately decided not to do was network analysis, either using a tool in ArcGIS or Gephi. Network analysis could have been used to identify the importance of individuals who witnessed for each other, specifically military and immigrant communities homesteading near each other. This output is usually geocoded, meaning it could be easily overlayed onto any of our maps thereby adding nuance to our interpretations of success and how success is measured.
In retrospect, the greatest plea we have for future homestead researchers is to be kind to geographers! Much of our energy was actually spent on reformatting our data table so that we could work with the data in our mapping software. Ask a GIS specialist before you start collecting data how to cleanly format your output tables so that the data can actually be used. Trust us, you will be saving your partner geographer a lot of frustration by getting formatting correct from the get-go.
Like Edwards et. al and others, we would implore a future researcher to work alongside or in addition to Fold3 to work on digitizing the Homestead records. The National Archives have open access to all of the Homestead records, but scanning historical documents is a laborious, sensitive process. With millions of records and a dozen or two pages for each record, there is no shortage of work to be done just making these data accessible.

Spatial Analysis of Homesteaders in Polk County, Nebraska by Esther Ramsey and Lukas Matthews is licensed under a Creative Commons Attribution-NonCommercial-ShareAlike 4.0 International License.