Statistics Behind Widget

To return to the project, click here.

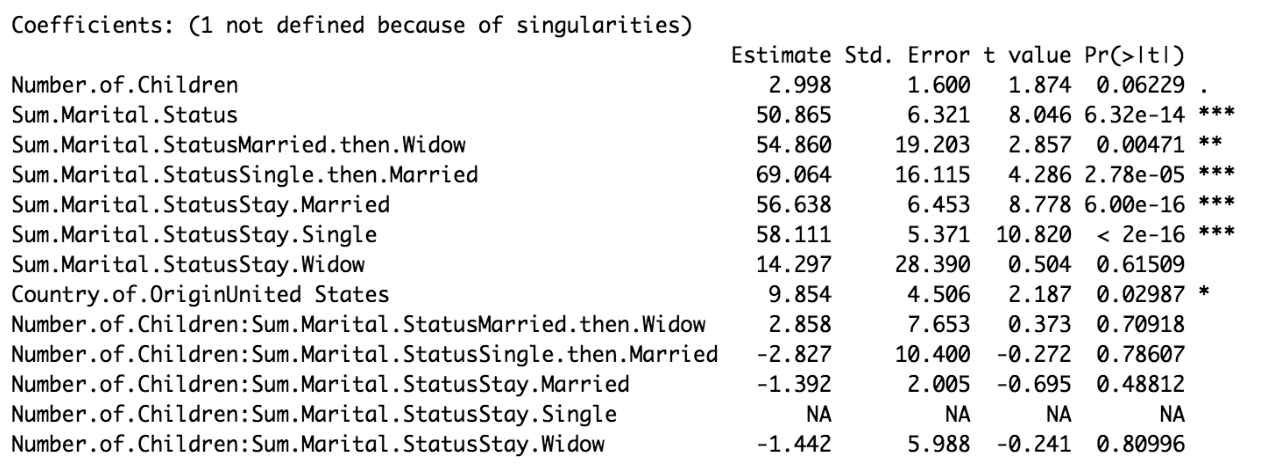
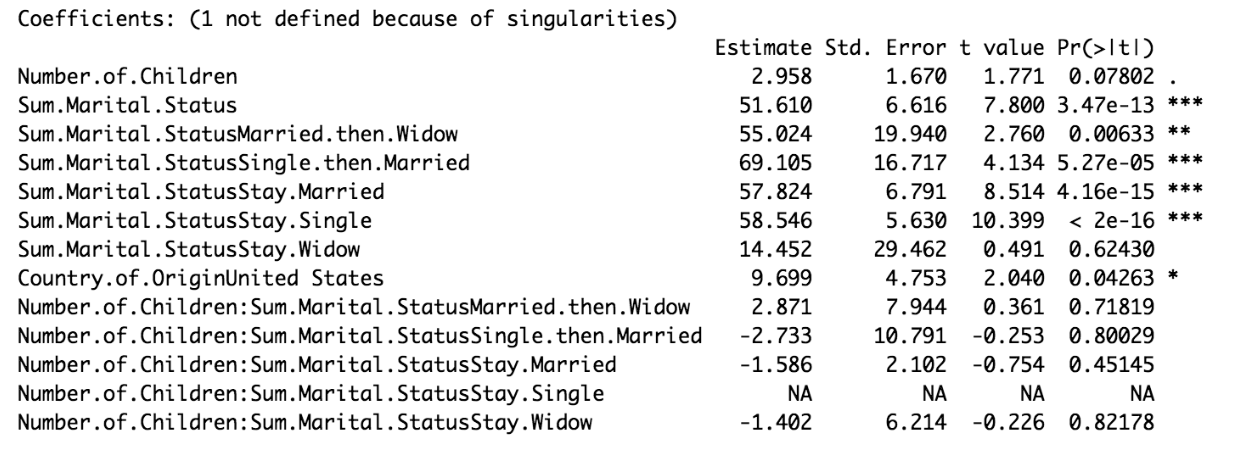
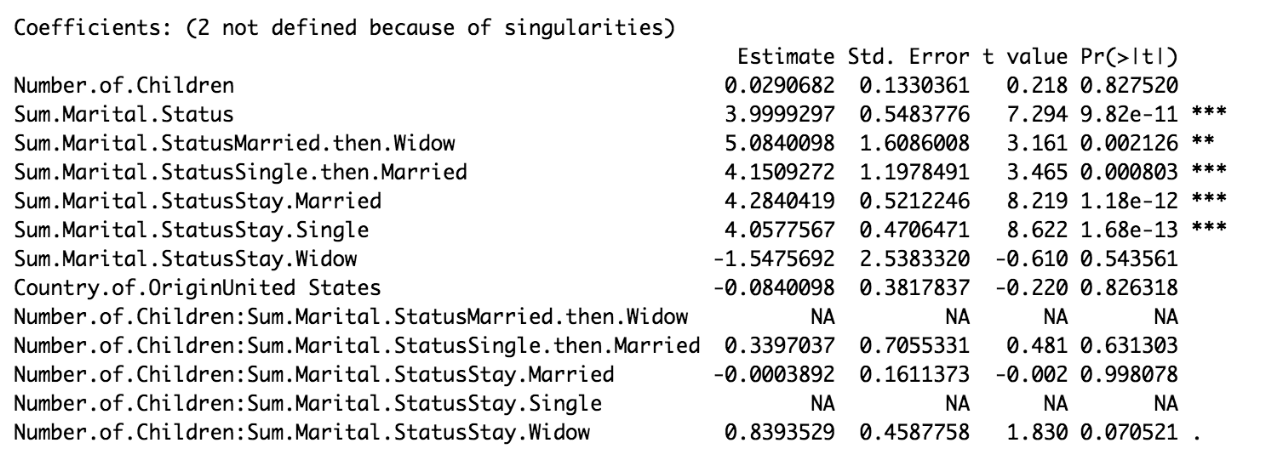
The estimates indicate how much more the y value (ex. Acres Claimed, Acres cultivated) will increase or decrease based on the variable. The stars on the right indicate statistical significance–only those with statistical significance were included in the widget.

Acres Claimed Model:

+1 Child, +4.3240 acres claimed Married then widow: +105.0922 Single then married: +99.4470 Stay married: +89.0250 Stay single: +88.5261 Stay widow: +60.8612 Other: +86.5629 United States origin: 32.5442 Stay married, +1 child: -5.3282

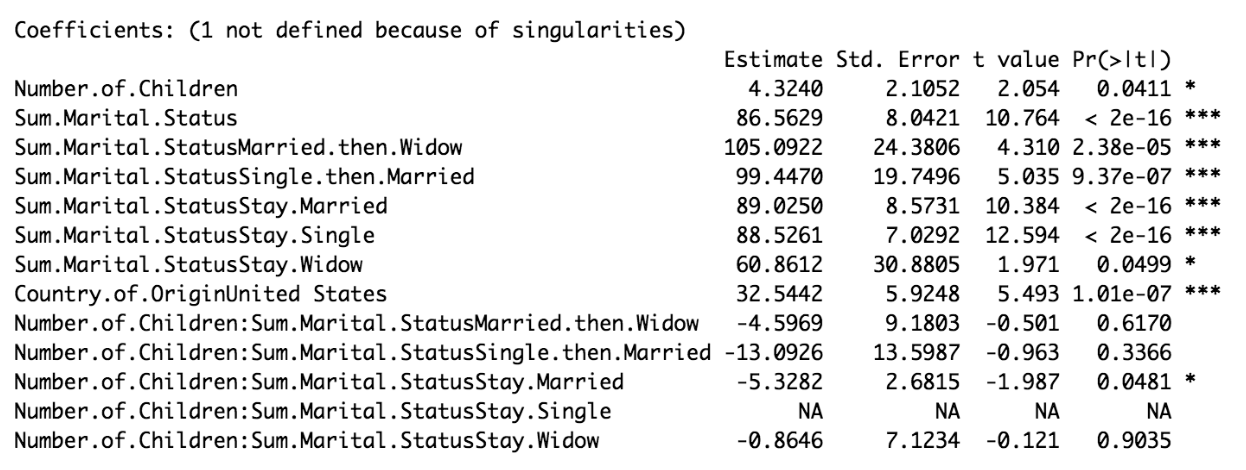
Ex. +1 child, +4.324 acres claimed

Acres Cultivated Model:

+1 Child, +2.998 acres cultivated Married then widow: +54.860 Single then married: +69.064 Stay married: +56.638 Stay single: +58.111 Stay widow: 0 Other: +50.865 United States origin: 9.854

Acres Broken Model:

+1 Child, +2.958 acres broken Married then widow: +55.024 Single then married: +69.105 Stay married: +57.824 Stay single: +58.546 Stay widow: 0 Other: +51.610 United States origin: 9.699 Stay married, +1 child: 0

Number of improvements prediction:

Number of improvements prediction Unknown marriage status: +3.54220 improvements Single then married: +3.11686 Stay married: +3.75215

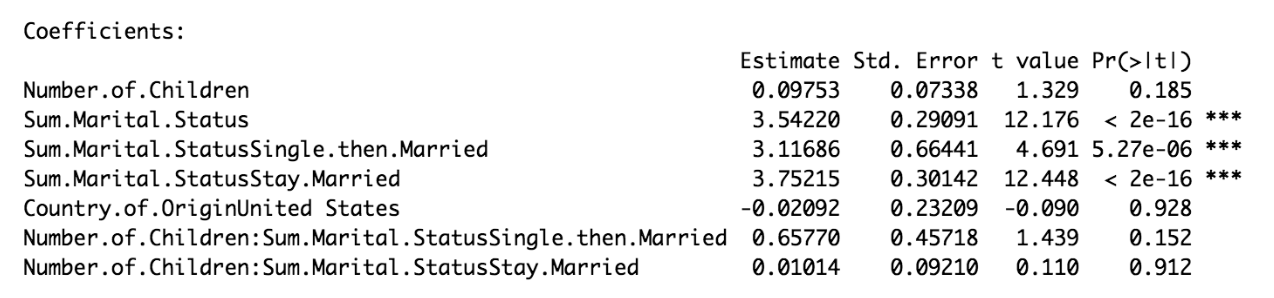
Number of crops prediction:

Number of crops prediction Unknown marital status: +4 crops Married then widow: +5 crops Single then married: +4 crops Stay married: +4 crops Stay single: +4 crops

These were similarly made using an elimination model, as explained in the Methodology section of the project. To return to the project, click here.


Creative Commons License
Stuck in a Sod House: The Impact of Family Structure on Homestead Value by Fiona Adams is licensed under a Creative Commons Attribution-NonCommercial-ShareAlike 4.0 International License.